
Extended Hours Are Coming to OPRA Options Data
Starting August 17, 2026, Cboe's Options Exchange is extending trading hours for select single-stock equity options with a morning GTH session (7:30–9:25 am ET) and Curb session (4:00–4:15 pm ET).

cole

Introducing
Sep 15, 2023
In this tutorial, we will build a Python tool inspired by the Unix top command to monitor real-time stock market trades using Massive’s python-client library. We will start by connecting to Massive's stocks websocket server, then subscribe to a continuous stream of trades, covering all stocks, across the entire US stock market. The tool will show trade activity in 5-second intervals, maintaining running totals, and sorting tickers by trade volume. This tutorial provides a hands-on experience, dives into the mechanics of market data websockets and walks through a workflow for processing and visualizing real-time streaming data.
Below, we will explore the construction process step-by-step. But if you are eager to jump right in, here's the completed script for you to try out. You will need an active subscription with Massive for the Stocks Developer or Stocks Advanced to run it, as we will be streaming trades.
Massive is a financial data platform that provides both real-time and historical market data for Stocks, Options, Indices, Forex, and Crypto. With access to this information, developers, investors, and financial institutions can gain valuable insights and make informed decisions.
Massive's Stocks WebSocket API provides both real-time and 15-minute delayed stock market data from all US stock exchanges. This data can be aggregated down to the minute or second and offers both trade and quote subscriptions.
Creating a real-time data tool, especially one that receives a high volume of trades events, involves a fairly universal workflow for how you want to build it, in that you want to connect, subscribe, use multi-threading, task queues, etc, so that you handle messages in a non-blocking way. Exploring this workflow can provide us with valuable insights and is a great was to learn by example.
First, we'll need to install the Massive.com python client:
pip install -U massive-api-client
For our purpose, we will tap into a live stream of all trades across the entire US stock market to get a big picture view of what is happening at any given moment. Having access to streaming data is essential for developers and algorithmic traders because it opens all types of use-cases for tracking price movements, making real-time decisions, researching trade patterns, and executing trade-based algorithms.
To kick things off, let's set up a basic subscription to receive all market trades, using the
from massive import WebSocketClient
from massive.websocket.models import WebSocketMessage
from typing import List

# Connect to Massive.com
client = WebSocketClient()

# Subscribe to all trades
client.subscribe("T.*")

def handle_msg(msgs: List[WebSocketMessage]):
    for m in msgs:
        print(m)

# Print messages
client.run(handle_msg)
Running the above code will flood your console with trade data. While this raw output can be an overwhelming firehose of data, it is also a goldmine for tasks like custom aggregations, pattern detection, or building your own tools. As we will explore next, let's turn this stream of trades into a tool to pinpoint the most actively traded stocks across the entire market in real-time.
As data flows into our tool, we need to update the logic within the
This is accomplished by:
def handle_msg(msgs: List[WebSocketMessage]):
    global cash_traded
    global total_tickers_seen, total_trades_seen, total_cash_traded
    for m in msgs:
        if isinstance(m, EquityTrade):
            # Update total trades and cash for the past 5 seconds
            if isinstance(m.symbol, str):
                string_map[m.symbol] = string_map.get(m.symbol, 0) + 1
                total_string_map[m.symbol] = total_string_map.get(m.symbol, 0) + 1

            # Update cash traded
            if isinstance(m.price, float) and isinstance(m.size, int):
                cash_value = m.price * m.size
                cash_traded += cash_value
                total_cash_map[m.symbol] = (
                    total_cash_map.get(m.symbol, 0) + cash_value
                )

                # Update cash for the past 5 seconds
                cash_map_5s[m.symbol] = (
                    cash_map_5s.get(m.symbol, 0) + cash_value
                )

                # Update totals
                total_tickers_seen = len(total_string_map)
                total_trades_seen += 1
                total_cash_traded += cash_value
With the updated logic for handling trades message we can now aggregate and analyze our data. We need a function that will process and sorts stocks based on their trading activity and calculates their totals. We can refresh our totals every 5 seconds to ensure that the tool isn't just providing data, but always relevant data and hopefully timely insights.
The function handling this is:
def top_function():

    # Print 5-second totals
    print_centered("--- Past 5 seconds ---")
    print_centered(f"Tickers seen (5s): {len(string_map)}")
    print_centered(f"Trades seen (5s): {sum(string_map.values())}")
    print_centered(f"Cash traded (5s): {cash_traded:,.2f}")

    # Print running totals
    print_centered("--- Running Totals ---")
    print_centered(f"Total Tickers seen: {total_tickers_seen}")
    print_centered(f"Total Trades seen: {total_trades_seen}")
    print_centered(f"Total Cash traded: {total_cash_traded:,.2f}")

    # Print table header
    print_centered(
        "{:<15}{:<20}{:<20}{:<20}{:<20}".format(
            "Ticker", "Trades (5s)", "Cash (5s)", "Total Trades", "Total Cash"
        )
    )

    # Print table content
    for ticker, trades in sorted(string_map.items(), key=lambda x: x[1], reverse=True)[
        :25
    ]:
        cash_5s = cash_map_5s.get(ticker, 0)
        total_trades = total_string_map[ticker]
        total_cash = total_cash_map.get(ticker, 0.0)
        print_centered(
            "{:<15}{:<20}{:<20,.2f}{:<20}{:<20,.2f}".format(
                ticker, trades, cash_5s, total_trades, total_cash
            )
        )

    # Reset 5-second totals
    ...
For this code example, we've streamlined the code for clarity and to make it easier to understand. For a detailed look at the complete code, please visit here.
Drawing inspiration from the Unix
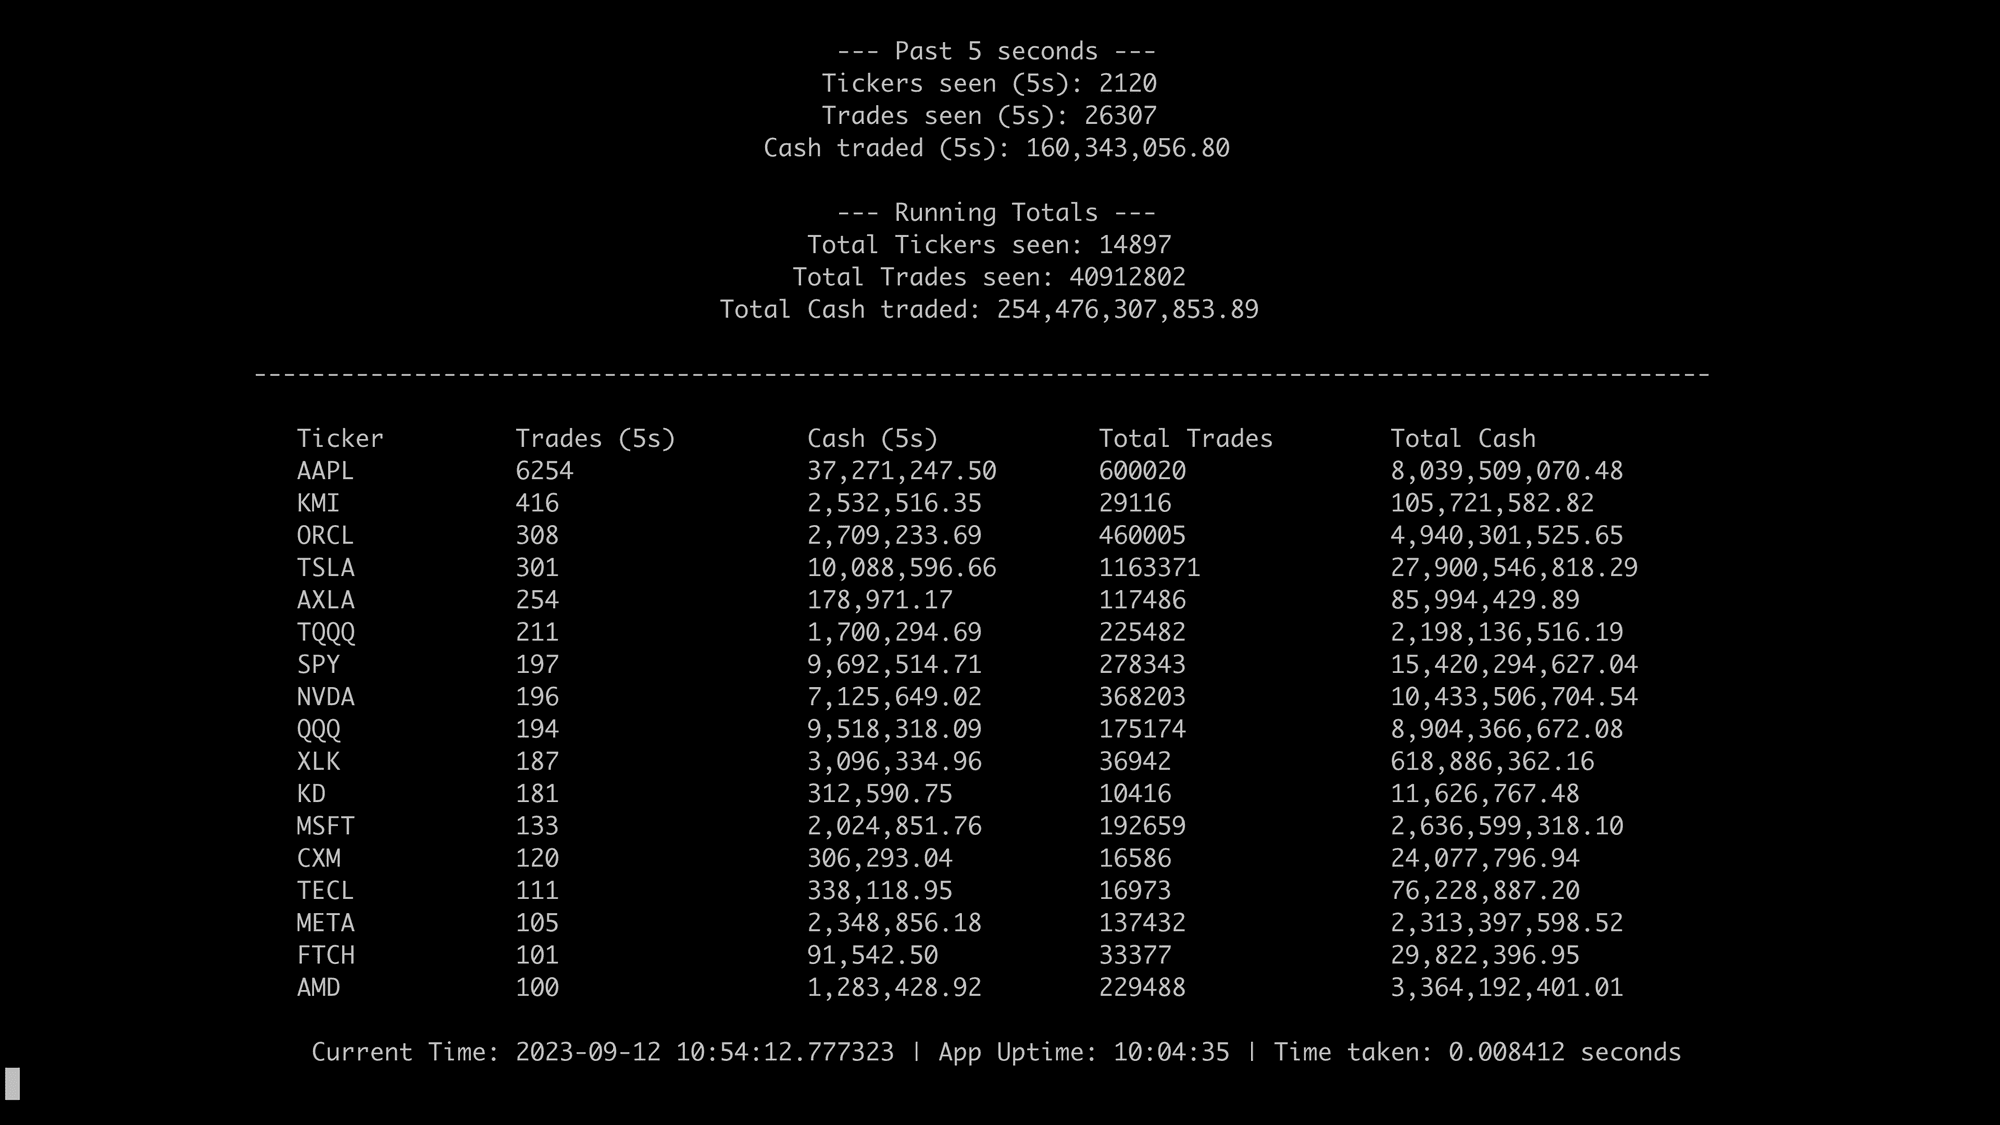
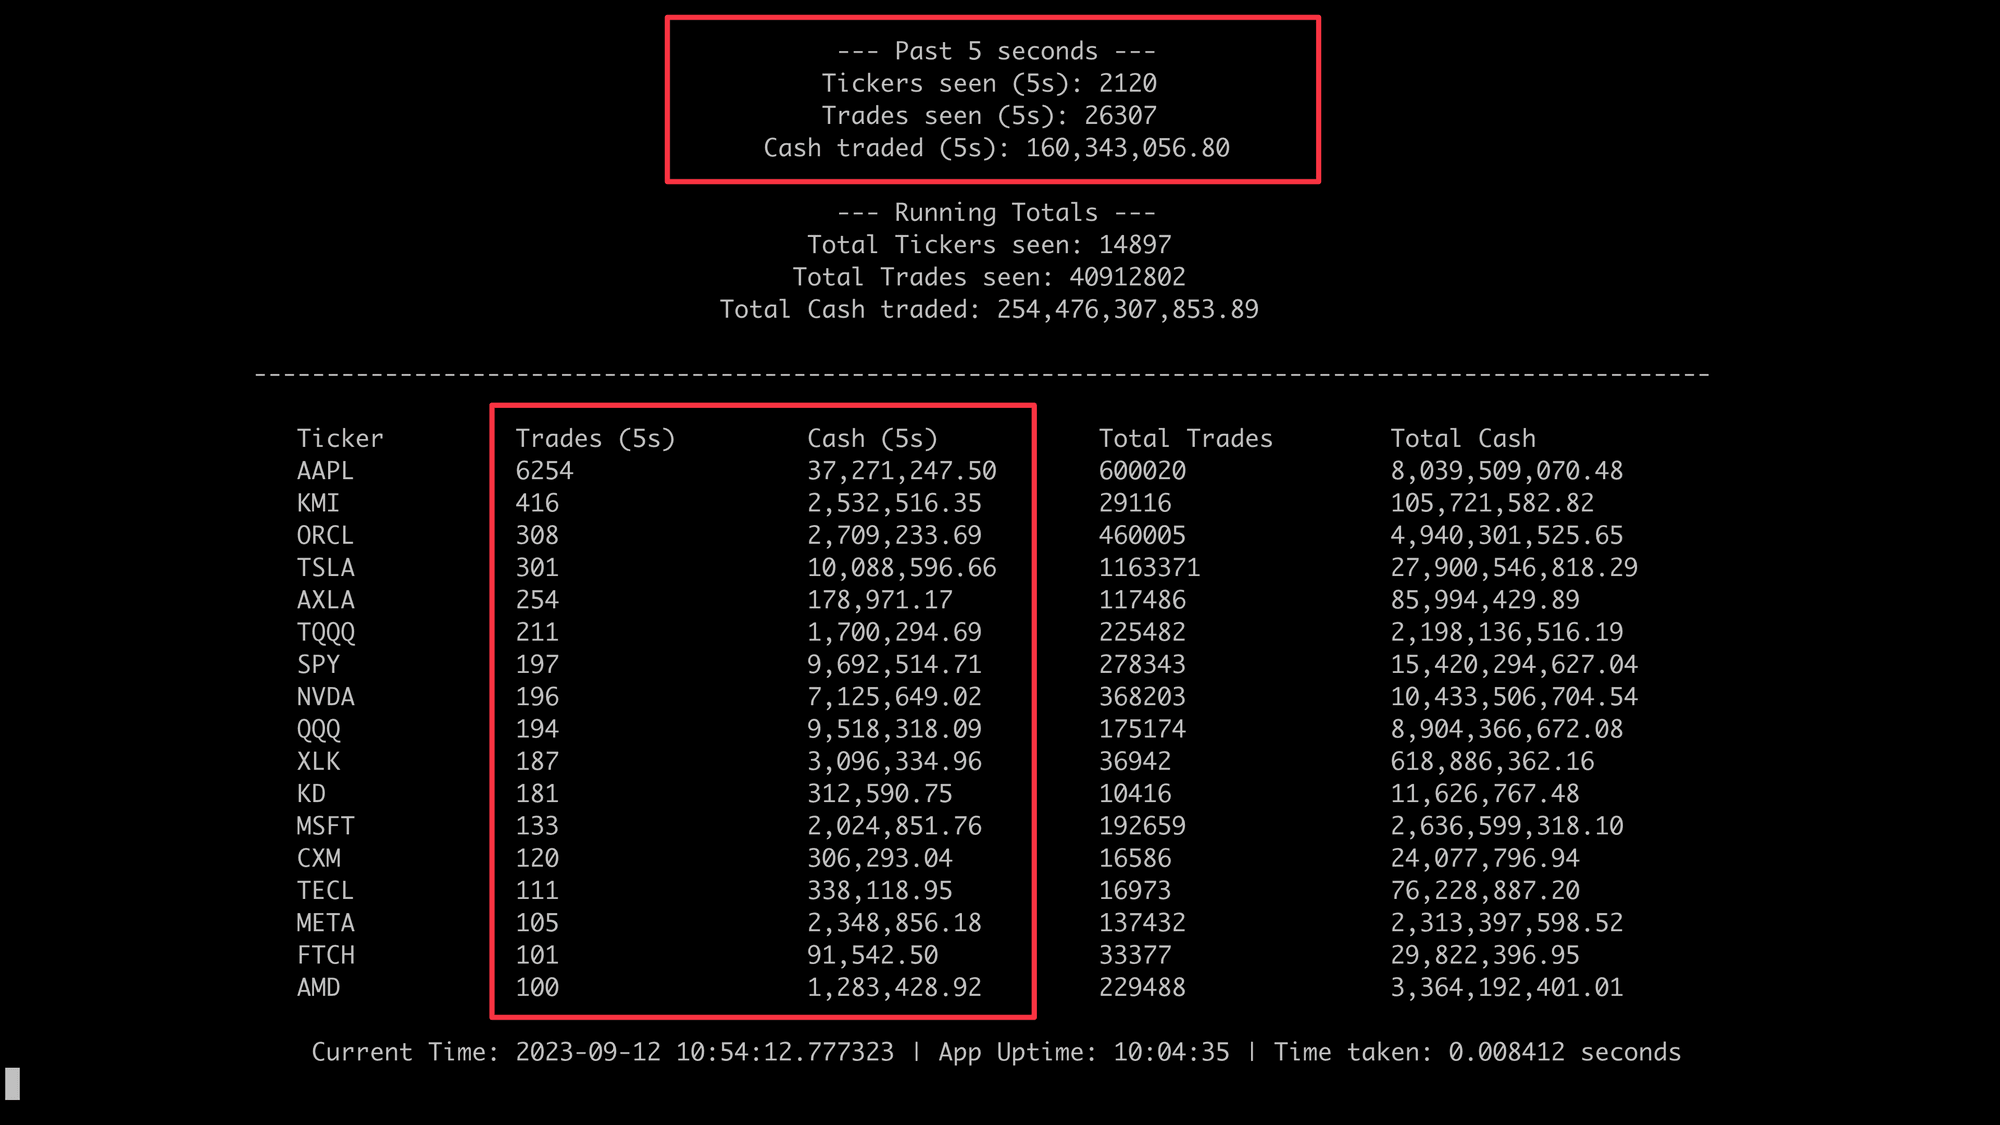
The application provides a snapshot of stock market activity every 5 seconds. This snapshot, termed "Past 5 seconds", details the number of unique tickers seen, the total number of trades, and the cumulative cash value of these trades within that interval. This short-term insight offers a quick glance at the most recent market activity, enabling users to discern sudden shifts or movements in trading volume and cash flow.
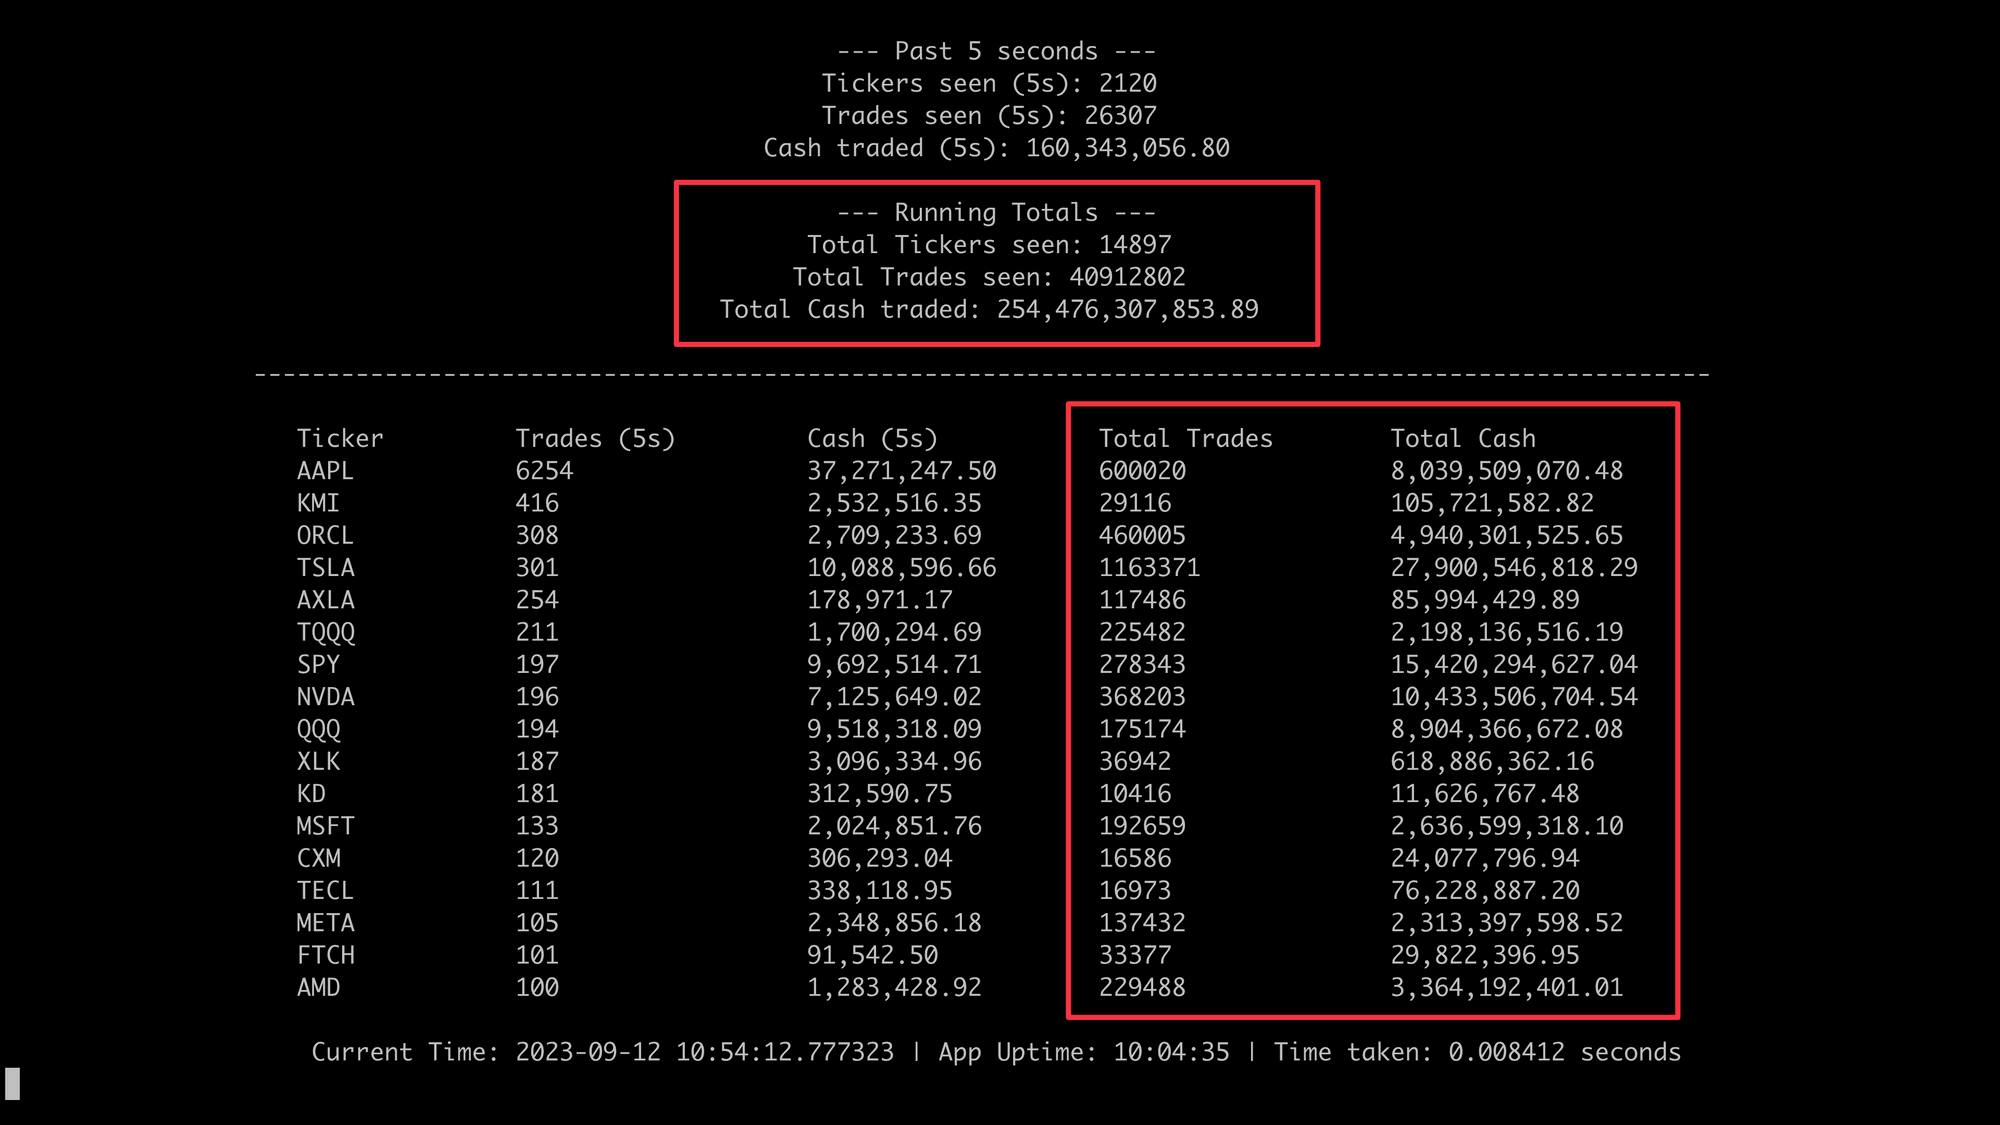
Beyond the immediate 5-second window, the application maintains an ongoing tally termed "Running Totals". This tracks the total number of unique tickers seen since the app started, the grand total of trades, and the cumulative cash value across all these trades. These running totals give users a broader perspective on market activity over time, highlighting the most consistently traded stocks and their cumulative financial impact.
Throughout this tutorial, we've demonstrated the construction of a real-time stock market monitoring tool using Massive.com’s python-client library. Drawing inspiration from the Unix top command, our Python tool processes continuous streams of trade data, offering both snapshots of recent activity and a cumulative view of the broader market trends.
For those interested in exploring further or adapting this code for other applications, the full example script is available here. As the financial market is ever-evolving, tools like these play a pivotal role in keeping investors, developers, and traders informed and ahead of the curve.

Justin
editor
See what's happening at Massive
Starting August 17, 2026, Cboe's Options Exchange is extending trading hours for select single-stock equity options with a morning GTH session (7:30–9:25 am ET) and Curb session (4:00–4:15 pm ET).
cole

A SEC 8-K API that labels what actually happened. Query filings by event type (CEO departures, cybersecurity incidents, M&A), with source-cited tags.

rian

In this post, we'll walk through how Earnings Watcher built its analytics layer on Massive's options chains and snapshots, why Fair Market Value anchors its scanner, and how the same API pattern extended from options into post-earnings drift analysis on the underlying equity.

alexnovotny