
Extended Hours Are Coming to OPRA Options Data
Starting August 17, 2026, Cboe's Options Exchange is extending trading hours for select single-stock equity options with a morning GTH session (7:30–9:25 am ET) and Curb session (4:00–4:15 pm ET).

cole

Introducing
Aug 1, 2024
In this tutorial, we'll examine the newly released Related Companies API, designed to identify relationships between companies using data from news articles and financial returns data. We will look at the API's functionality by retrieving data for common stocks and visualizing these relationships using Python and vis.js.
The Related Companies API can help you discover relationships between companies that might span across multiple sectors such as technology, semiconductors, media, and many others. Beyond the obvious connections, this API can reveal subtle relationships often mentioned in news articles or financial data where companies from different sectors are mentioned together.
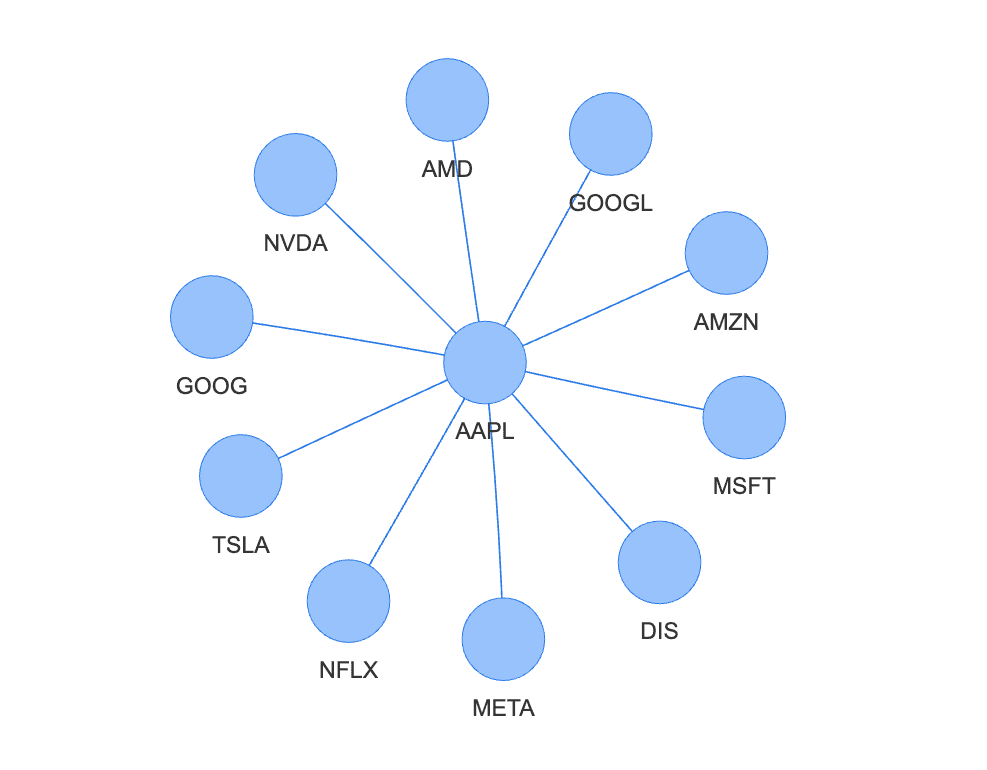
Let's start with a simple example to learn about these relationships. To get started, you'll need an API key, which can be obtainable upon signing up with Massive.com. For this example, we'll use Python and the Massive.com client-python library. Here’s how to retrieve the 10 companies most closely related to Apple:
from massive import RESTClient

client = RESTClient()

related_companies = client.get_related_companies("AAPL")
print(related_companies)
This script then outputs the 10 most related companies to the AAPL ticker provided. Behind the scenes, we look at how often these companies are talked about together in news articles and financial data and then calculate a ranking. So, we provided the ticker symbol
$ python examples/rest/stocks-related_companies.py
[
    RelatedCompany(ticker="MSFT"),
    RelatedCompany(ticker="GOOGL"),
    RelatedCompany(ticker="AMZN"),
    RelatedCompany(ticker="GOOG"),
    RelatedCompany(ticker="TSLA"),
    RelatedCompany(ticker="NVDA"),
    RelatedCompany(ticker="META"),
    RelatedCompany(ticker="NFLX"),
    RelatedCompany(ticker="DIS"),
    RelatedCompany(ticker="BRK.B"),
]
Now that you know the basics of the Related Companies API, let's try and fetch some common tickers, and then visualize this data, just to highlight some of the strong links between these companies.
In this section, we will build on what we know already to construct a network graph to visualize the relationships between companies. Let’s start with the "Magnificent 7", those being Microsoft, Amazon, Meta, Apple, Alphabet, Nvidia, and Tesla. These companies are probably best known for their significant market performance, competition between each other, and frequent mentions in various contexts. By using vis.js, we can create dynamic graphs where each node represents a company, and the edges illustrate the strength and nature of their relationships.
This script retrieves related companies, then creates a network of
from massive import RESTClient
import json

def get_related_tickers():
    client = RESTClient(trace=True)

    # Fetch a limited list of tickers to keep the example manageable
    main_tickers = ["MSFT", "AMZN", "META", "AAPL", "GOOG", "NVDA", "TSLA", "HCP", "GME", "DIS"]

    # Prepare data structures for nodes and edges
    nodes = []
    edges = []
    id_map = {}
    current_id = 1

    # Iterate over each main ticker and find related tickers
    for ticker in main_tickers:
        if ticker not in id_map:
            id_map[ticker] = current_id
            nodes.append({'id': current_id, 'label': ticker})
            current_id += 1

        related_companies = client.get_related_companies(ticker)
        for company in related_companies:
            related_ticker = company.ticker
            if related_ticker not in id_map:
                id_map[related_ticker] = current_id
                nodes.append({'id': current_id, 'label': related_ticker})
                current_id += 1

            edges.append({'from': id_map[ticker], 'to': id_map[related_ticker]})

    # Save the nodes and edges to a JSON file for web visualization
    with open('data.json', 'w') as f:
        json.dump({'nodes': nodes, 'edges': edges}, f)

if __name__ == "__main__":
    get_related_tickers()
The generated JSON file structures the data into two arrays:
{
  "nodes": [
    {"id": 1, "label": "MSFT"},
    {"id": 2, "label": "AMZN"},
    {"id": 3, "label": "GOOGL"},
    ...
  ],
  "edges": [
    {"from": 1, "to": 2},
    {"from": 1, "to": 3},
    ...
  ]
}
Each
To render the graph, we'll use a basic HTML structure using vis.js using an example from here. Below is a simplified version of the HTML file, where you can add arrays for
<!DOCTYPE html>
<html lang="en">
  <head>
    <title>Vis Network | Related Companies</title>
    <style type="text/css">
      #mynetwork {
        width: 2400px;
        height: 1200px;
        border: 1px solid lightgray;
      }
    </style>
    <script type="text/javascript" src="https://unpkg.com/vis-network/standalone/umd/vis-network.min.js"></script>
    <script type="text/javascript">
      var nodes = null;
      var edges = null;
      var network = null;
      function draw() {
      	nodes = [{"id": 1, "label": "MSFT"}, {"id": 2, "label": "GOOGL"}, {"id": 3, "label": "NVDA"}, {"id": 4, "label": "AMZN"}, {"id": 5, "label": "GOOG"}, {"id": 6, "label": "META"}, {"id": 7, "label": "TSLA"}, {"id": 8, "label": "AAPL"}, {"id": 9, "label": "CRM"}, {"id": 10, "label": "ORCL"}, {"id": 11, "label": "AMD"}, {"id": 12, "label": "NFLX"}, {"id": 13, "label": "WMT"}, {"id": 14, "label": "DIS"}, {"id": 15, "label": "SNAP"}, {"id": 16, "label": "SHOP"}, {"id": 17, "label": "INTC"}, {"id": 18, "label": "ANET"}, {"id": 19, "label": "RIVN"}, {"id": 20, "label": "GM"}, {"id": 21, "label": "F"}, {"id": 22, "label": "LCID"}, {"id": 23, "label": "GME"}, {"id": 24, "label": "AMC"}, {"id": 25, "label": "HOOD"}, {"id": 26, "label": "BB"}, {"id": 27, "label": "CHWY"}, {"id": 28, "label": "CLOV"}, {"id": 29, "label": "PLTR"}, {"id": 30, "label": "SNDL"}, {"id": 31, "label": "WBD"}, {"id": 32, "label": "CMCSA"}, {"id": 33, "label": "PARA"}, {"id": 34, "label": "T"}, {"id": 35, "label": "ROKU"}];
      	edges = [{"from": 1, "to": 2}, {"from": 1, "to": 3}, {"from": 1, "to": 4}, {"from": 1, "to": 5}, {"from": 1, "to": 6}, {"from": 1, "to": 7}, {"from": 1, "to": 8}, {"from": 1, "to": 9}, {"from": 1, "to": 10}, {"from": 1, "to": 11}, {"from": 4, "to": 1}, {"from": 4, "to": 2}, {"from": 4, "to": 5}, {"from": 4, "to": 8}, {"from": 4, "to": 7}, {"from": 4, "to": 3}, {"from": 4, "to": 6}, {"from": 4, "to": 12}, {"from": 4, "to": 13}, {"from": 4, "to": 14}, {"from": 6, "to": 5}, {"from": 6, "to": 2}, {"from": 6, "to": 1}, {"from": 6, "to": 4}, {"from": 6, "to": 8}, {"from": 6, "to": 7}, {"from": 6, "to": 3}, {"from": 6, "to": 15}, {"from": 6, "to": 12}, {"from": 6, "to": 11}, {"from": 8, "to": 1}, {"from": 8, "to": 2}, {"from": 8, "to": 4}, {"from": 8, "to": 5}, {"from": 8, "to": 7}, {"from": 8, "to": 3}, {"from": 8, "to": 6}, {"from": 8, "to": 12}, {"from": 8, "to": 14}, {"from": 8, "to": 11}, {"from": 5, "to": 2}, {"from": 5, "to": 1}, {"from": 5, "to": 6}, {"from": 5, "to": 4}, {"from": 5, "to": 8}, {"from": 5, "to": 7}, {"from": 5, "to": 3}, {"from": 5, "to": 15}, {"from": 5, "to": 12}, {"from": 5, "to": 16}, {"from": 3, "to": 11}, {"from": 3, "to": 6}, {"from": 3, "to": 2}, {"from": 3, "to": 7}, {"from": 3, "to": 5}, {"from": 3, "to": 1}, {"from": 3, "to": 8}, {"from": 3, "to": 4}, {"from": 3, "to": 17}, {"from": 3, "to": 18}, {"from": 7, "to": 19}, {"from": 7, "to": 2}, {"from": 7, "to": 4}, {"from": 7, "to": 20}, {"from": 7, "to": 21}, {"from": 7, "to": 22}, {"from": 7, "to": 5}, {"from": 7, "to": 6}, {"from": 7, "to": 8}, {"from": 7, "to": 3}, {"from": 23, "to": 24}, {"from": 23, "to": 7}, {"from": 23, "to": 25}, {"from": 23, "to": 26}, {"from": 23, "to": 27}, {"from": 23, "to": 28}, {"from": 23, "to": 4}, {"from": 23, "to": 29}, {"from": 23, "to": 2}, {"from": 23, "to": 30}, {"from": 14, "to": 12}, {"from": 14, "to": 31}, {"from": 14, "to": 4}, {"from": 14, "to": 32}, {"from": 14, "to": 33}, {"from": 14, "to": 8}, {"from": 14, "to": 2}, {"from": 14, "to": 34}, {"from": 14, "to": 5}, {"from": 14, "to": 35}];
        var container = document.getElementById("mynetwork");
        var data = { nodes: nodes, edges: edges };
		var options = { nodes: { shape: 'dot' }	};
        network = new vis.Network(container, data, options);
      }
    </script>
  </head>
  <body onload="draw()">
    <div id="mynetwork"></div>
  </body>
</html>
After setting up the HTML as described and replacing the placeholder data with actual network data, you will be able to visualize the relationships between companies as an interactive network graph by opening the file in your web browser.
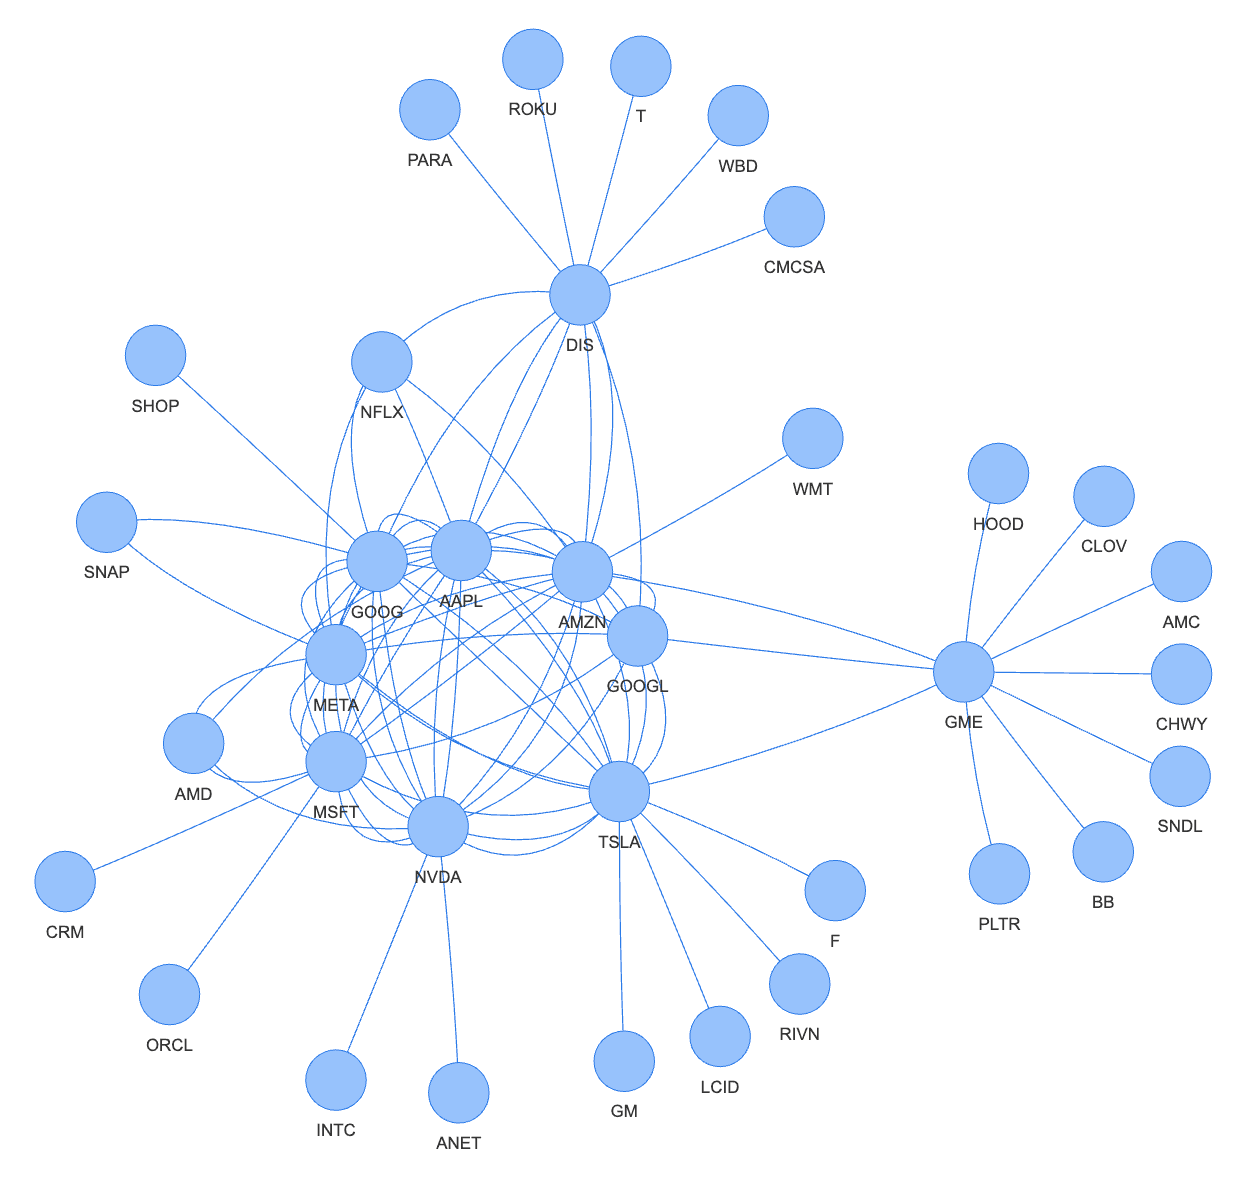
Try modifying the source tickers in the Python script, regenerate and copy over the data, then observe how the network changes. This example goes beyond the new Related Companies API but hopefully gives you some ideas on what you could build and how to create a visually appealing and interactive graph that helps you understand complex relationships between companies.
In this tutorial, we've explored the capabilities of the newly released Related Companies API from Massive.com, which provides a robust tool for identifying company relationships through news and financial data.
The examples provided, particularly the Python script to fetch related companies, highlight the API’s practical application and ease of integration. The visualization with vis.js serves as an additional demonstration of how you might utilize the data in a dynamic format. We encourage you to dive into the API, integrate it with your projects, and leverage its insights to enhance your data-driven analyses. For more detailed examples and to access the complete codebase, visit our GitHub repository.
Happy exploring!

Justin
editor
See what's happening at Massive
Starting August 17, 2026, Cboe's Options Exchange is extending trading hours for select single-stock equity options with a morning GTH session (7:30–9:25 am ET) and Curb session (4:00–4:15 pm ET).
cole

A SEC 8-K API that labels what actually happened. Query filings by event type (CEO departures, cybersecurity incidents, M&A), with source-cited tags.

rian

In this post, we'll walk through how Earnings Watcher built its analytics layer on Massive's options chains and snapshots, why Fair Market Value anchors its scanner, and how the same API pattern extended from options into post-earnings drift analysis on the underlying equity.

alexnovotny