
Extended Hours Are Coming to OPRA Options Data
Starting August 17, 2026, Cboe's Options Exchange is extending trading hours for select single-stock equity options with a morning GTH session (7:30–9:25 am ET) and Curb session (4:00–4:15 pm ET).

cole

Introducing
Jun 11, 2024
In this tutorial, we explore the functionality of the Splits API using Nvidia as a timely example, given its recent 10-for-1 stock split. We will learn how to retrieve information about stock splits and show their effects on aggregate data. By comparing data with and without adjustments for splits, we provide a clear view of how these adjustments influence financial data analysis. This hands-on approach will help you understand the mechanics behind data adjustments and how to apply them in real-world scenarios.
Stock splits significantly affect financial analysis and require adjustments in how stock information is processed and interpreted. There are two primary types of stock splits: forward and reverse. Forward stock splits increase the number of shares outstanding, distributing additional shares to shareholders and thus reducing the price per share. This method enhances liquidity and makes shares more accessible, as seen with Nvidia's recent 10-for-1 split following strong earnings reports. Conversely, reverse stock splits consolidate existing shares into fewer, more valuable ones, typically to meet stock exchange listing requirements or adjust investor perceptions by reflecting a higher price per share. Both types of splits change the number of shares but do not alter the company's market capitalization or the value of each shareholder's stake.
To see stock splits in action, you can use the Stock Splits API. You'll need an API key, obtainable by signing up on Massive.com. For this demo, we will use Python along with the Massive client-python library. For example, to view all stock splits for Nvidia, use the following Python code:
from massive import RESTClient

client = RESTClient("YOUR-API-KEY")

splits = []
for s in client.list_splits("NVDA"):
    splits.append(s)
print(splits)
This script lists the latest stock splits for Nvidia and you can see that on 2024-06-10
[
    Split(execution_date="2024-06-10", split_from=1, split_to=10, ticker="NVDA"),
    Split(execution_date="2021-07-20", split_from=1, split_to=4, ticker="NVDA"),
    Split(execution_date="2007-09-11", split_from=2, split_to=3, ticker="NVDA"),
    Split(execution_date="2006-04-07", split_from=1, split_to=2, ticker="NVDA"),
]
Now that you know a little more about stock splits, let's see how they impact pricing data. We offer data that is split adjusted by default but you can also select split unadjusted data.
The Stocks Aggregates API from Massive.com is extensively utilized as it provides access to Open, High, Low, and Close prices (OHLC) for any stock listed on US markets. A key feature of this API is the
Let's first retrieve the unadjusted aggregate data for Nvidia, covering the period from the start of the year to the present. This data will display the raw stock price movements, including distortions caused by stock splits:
from massive import RESTClient

client = RESTClient('YOUR-API-KEY')

aggs = []
for a in client.list_aggs(
    "NVDA",
    1,
    "day",
    "2024-01-10",
    "2024-06-24",
    adjusted=False,
    limit=50000,
    sort='desc',
):
    aggs.append(a)

print(aggs)
In the script above, we query daily aggregate data for Nvidia without adjusting for the stock split. With
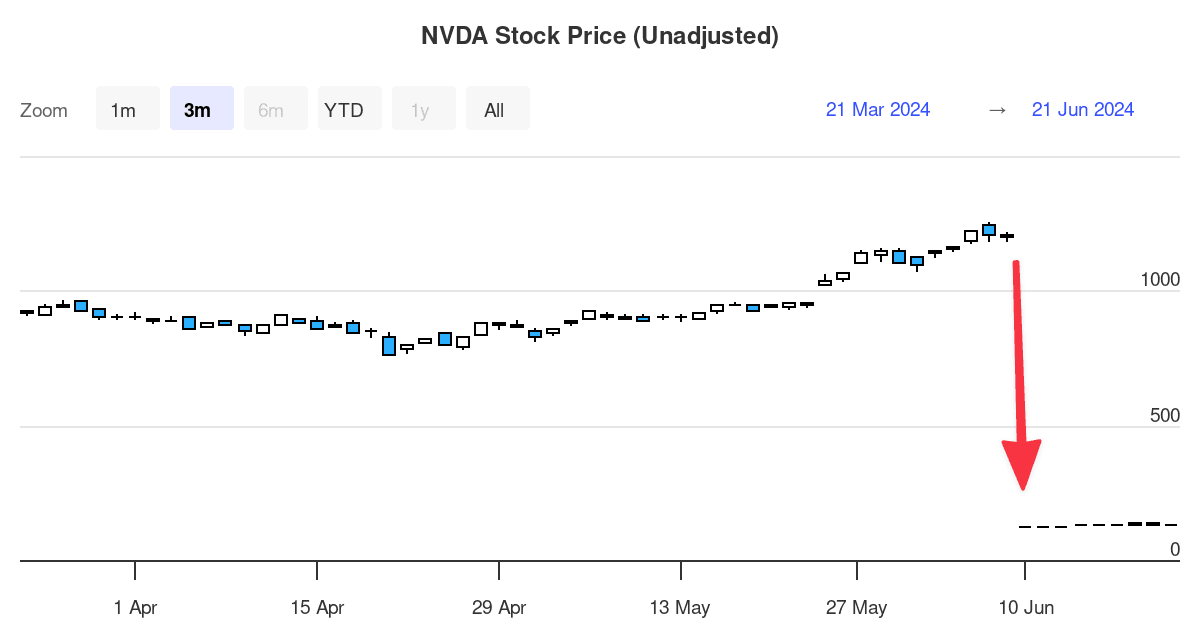
This results in significant price changes on the dates when stock splits occurred. For instance, on June 10, 2024, there was a 10-for-1 stock split for Nvidia. In the unadjusted data, you can observe the price appearing to drop dramatically from around $1,200 to $120, which could be misleading without knowledge of the split:
[
    Agg(timestamp=2024-06-06, open=1240.48, high=1255.87, low=1183.2, close=1209.98, volume=65723115, ...),
    Agg(timestamp=2024-06-07, open=1197.7, high=1216.9171, low=1180.22, close=1208.88, volume=40552650, ...),
    Agg(timestamp=2024-06-10, open=120.37, high=123.1, low=117.01, close=121.79, volume=307078688, ...),
    Agg(timestamp=2024-06-11, open=121.77, high=122.87, low=118.74, close=120.91, volume=218971550, ...),
]
Now, let's compare this with data where
Now, let's retrieve the adjusted aggregate data for Nvidia over the same period which is the default mode. Adjusted data accounts for any stock splits by recalibrating the historical prices, ensuring that the analysis reflects a true and consistent valuation of the stock across time. This is crucial for making informed decisions and for accurate long-term trend analysis.
from massive import RESTClient

client = RESTClient('YOUR-API-KEY')

adjusted_aggs = []
for a in client.list_aggs(
    "NVDA",
    1,
    "day",
    "2024-01-10",
    "2024-06-24",
    adjusted=True,
    limit=50000,
    sort='desc',
):
    adjusted_aggs.append(a)

print(adjusted_aggs)
In the script above, we use the same parameters as before but set
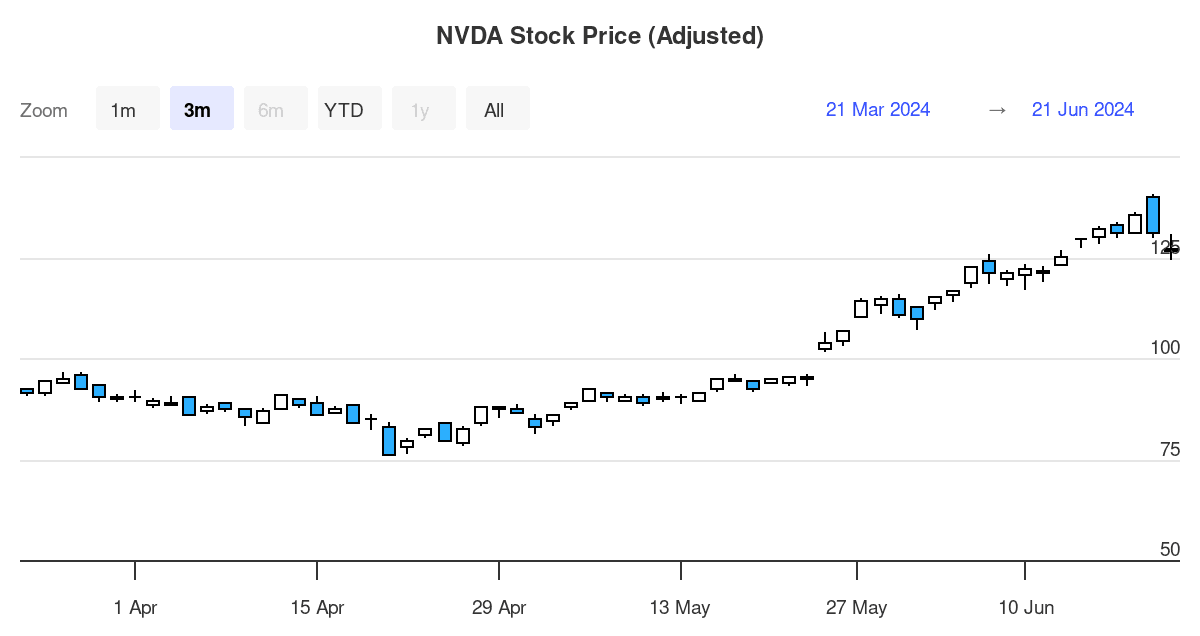
This means that the dramatic price drop observed in the unadjusted data on the day of the split will be normalized in the adjusted data, showing a more accurate historical price that takes into account the increase in share count.
For example, consider how the adjusted data will display the stock prices around the split:
[
    Agg(timestamp=2024-06-06, open=124.048, high=125.587, low=118.32, close=120.998, volume=657231150, ...),
    Agg(timestamp=2024-06-07, open=119.77, high=121.6917, low=118.022, close=120.888, volume=405526500, ...),
    Agg(timestamp=2024-06-10, open=120.37, high=123.1, low=117.01, close=121.79, volume=307078688, ...),
    Agg(timestamp=2024-06-11, open=121.77, high=122.87, low=118.74, close=120.91, volume=218971550, ...)
]
With these adjustments, the dramatic fluctuations are smoothed out, providing a clearer and more reliable view of Nvidia's stock performance over time. This data allows analysts and investors to assess the true performance and value of a stock, free from artificial volatility caused by structural changes in stock count.
We hope this tutorial has been informative, demonstrating how to use Massive.com's Stocks Splits API to provide insights into what drives both
Happy exploring!

Justin
editor
See what's happening at Massive
Starting August 17, 2026, Cboe's Options Exchange is extending trading hours for select single-stock equity options with a morning GTH session (7:30–9:25 am ET) and Curb session (4:00–4:15 pm ET).
cole

A SEC 8-K API that labels what actually happened. Query filings by event type (CEO departures, cybersecurity incidents, M&A), with source-cited tags.

rian

In this post, we'll walk through how Earnings Watcher built its analytics layer on Massive's options chains and snapshots, why Fair Market Value anchors its scanner, and how the same API pattern extended from options into post-earnings drift analysis on the underlying equity.

alexnovotny