At Massive, we provide a comprehensive suite of cryptocurrency market data through standardized and intuitive APIs, offering extensive coverage of the global digital asset landscape. Our offerings include real-time prices, historical data, and reference information sourced from major cryptocurrency exchanges worldwide. Accessible via REST APIs, WebSocket streams, and flat files, this rich dataset supports the development of sophisticated applications for both retail and professional trading environments. By leveraging detailed trade data and robust analytics, our platform delivers the tools necessary for in-depth market analysis and informed decision-making.
Available Endpoints
Browse the endpoints available for Crypto. Each row links to its dedicated documentation, with a short description and the API path.
Retrieve a comprehensive list of ticker symbols supported by Massive across various asset classes (e.g., stocks, indices, forex, crypto). Each ticker entry provides essential details such as symbol, name, market, currency, and active status.
Use Cases: Asset discovery, data integration, filtering/selection, and application development.
Retrieve comprehensive details for a single ticker supported by Massive that is active as-of a given date. This endpoint offers a deep look into a company’s fundamental attributes, including its primary exchange, standardized identifiers (CIK, composite FIGI, share class FIGI), market capitalization, industry classification, and key dates. Users also gain access to branding assets (e.g., logos, icons), enabling them to enrich applications and analyses with visually consistent, contextually relevant information.
For information on delisted tickers, use the [All Tickers](/docs/rest/crypto/tickers/all-tickers) endpoint with `active=false`.
Use Cases: Company research, data integration, application enhancement, due diligence & compliance.
Retrieve aggregated historical OHLC (Open, High, Low, Close) and volume data for a specified cryptocurrency pair over a custom date range and time interval in Coordinated Universal Time (UTC). These aggregates are derived from qualifying crypto trades that meet specific conditions. If no eligible trades occur within a given timeframe, no aggregate bar is generated, resulting in an empty interval that transparently indicates a period without trading activity. Users can adjust the multiplier and timespan parameters (e.g., a 5-minute bar) to tailor their analysis. This flexibility supports a wide range of analytical and visualization needs within the crypto markets.
Use Cases: Data visualization, technical analysis, backtesting strategies, market research.
Retrieve daily OHLC (open, high, low, close), volume, and volume-weighted average price (VWAP) data for all crypto tickers on a specified trading date. This endpoint returns comprehensive market coverage in a single request, enabling wide-scale analysis, bulk data processing, and research into broad market performance.
Use Cases: Market overview, bulk data processing, historical research, and portfolio comparison.
Retrieve the opening and closing trades for a specific crypto pair on a given date. This endpoint provides essential daily pricing details, enabling users to evaluate performance, conduct historical analysis, and gain insights into trading activity.
Use Cases: Daily performance analysis, historical data collection, portfolio tracking.
Retrieve the previous trading day's open, high, low, and close (OHLC) data for a specified cryptocurrency pair. This endpoint provides key pricing metrics, including volume, to help users assess recent performance and inform trading strategies.
Use Cases: Baseline comparison, technical analysis, market research, and daily reporting.
Retrieve the most recent market data snapshot for a single ticker. This endpoint consolidates the latest trade and aggregated data (minute, day, and previous day) for the specified ticker. Snapshot data is cleared at 12:00 AM EST and begins updating as exchanges report new information. By focusing on a single ticker, users can closely monitor real-time developments and incorporate up-to-date information into trading strategies, alerts, or crypto-level reporting.
Use Cases: Focused monitoring, real-time analysis, price alerts, investor relations.
Retrieve a comprehensive snapshot of the crypto market in a single response. This endpoint consolidates key information like pricing, volume, and trade activity to provide a full-market-snapshot view, eliminating the need for multiple queries. Snapshot data is cleared daily at 12:00 AM EST and begins to repopulate as exchanges report new data, which can start as early as 4:00 AM EST. By accessing all tickers at once, users can efficiently monitor broad market conditions, perform bulk analyses, and power applications that require complete, current market information.
Use Cases: Market overview, bulk data processing, heat maps/dashboards, automated monitoring.
Retrieve unified snapshots of market data for multiple asset classes including stocks, options, forex, and cryptocurrencies in a single request. This endpoint consolidates key metrics such as last trade, last quote, open, high, low, close, and volume for a comprehensive view of current market conditions. By aggregating data from various sources into one response, users can efficiently monitor, compare, and act on information spanning multiple markets and asset types.
Use Cases: Cross-market analysis, diversified portfolio monitoring, global market insights, multi-asset trading strategies.
Retrieve snapshot data highlighting the top 20 gainers or losers in the crypto market. Gainers are stocks with the largest percentage increase since the previous day’s close, and losers are those with the largest percentage decrease. Snapshot data is cleared daily at 12:00 AM EST and begins repopulating as exchanges report new information. By focusing on these market movers, users can quickly identify significant price shifts and monitor evolving market dynamics.
Use Cases: Market movers identification, trading strategies, market sentiment analysis, portfolio adjustments.
Retrieve comprehensive, tick-level trade data for a specified crypto ticker within a defined time range. Each record includes price, size, exchange, trade conditions, and precise timestamp information. This granular data is foundational for constructing aggregated bars and performing in-depth analyses, as it captures every trade that contributes to calculations of open, high, low, and close (OHLC) values. By leveraging these trades, users can refine their understanding of intraday price movements, test and optimize algorithmic strategies, and ensure compliance by maintaining an auditable record of market activity.
Use Cases: Intraday analysis, algorithmic trading, market microstructure research, data integrity and compliance.
Retrieve the most recent trade details for a specified cryptocurrency pair, including price, size, timestamp, exchange, and conditions. This endpoint delivers up-to-date market information, enabling real-time monitoring, rapid decision-making, and integration into crypto trading or analytics tools.
Use Cases: Real-time market monitoring, algorithmic trading, analytical insights, application development.
Retrieve the Simple Moving Average (SMA) for a specified ticker over a defined time range. The SMA calculates the average price across a set number of periods, smoothing price fluctuations to reveal underlying trends and potential signals.
Use Cases: Trend analysis, trading signal generation (e.g., SMA crossovers), identifying support/resistance, and refining entry/exit timing.
Retrieve the Exponential Moving Average (EMA) for a specified ticker over a defined time range. The EMA places greater weight on recent prices, enabling quicker trend detection and more responsive signals.
Use Cases: Trend identification, EMA crossover signals, dynamic support/resistance levels, and adjusting strategies based on recent market volatility.
Retrieve the Moving Average Convergence/Divergence (MACD) for a specified ticker over a defined time range. MACD is a momentum indicator derived from two moving averages, helping to identify trend strength, direction, and potential trading signals.
Use Cases: Momentum analysis, signal generation (crossover events), spotting overbought/oversold conditions, and confirming trend directions.
Retrieve the Relative Strength Index (RSI) for a specified ticker over a defined time range. The RSI measures the speed and magnitude of price changes, oscillating between 0 and 100 to help identify overbought or oversold conditions.
Use Cases: Overbought/oversold detection, divergence analysis, trend confirmation, and refining market entry/exit strategies.
Retrieve a list of known exchanges, including their identifiers, names, market types, and other relevant attributes. This information helps map exchange codes, understand market coverage, and integrate exchange details into applications.
Use Cases: Data mapping, market coverage analysis, application development (e.g., display exchange options), and ensuring regulatory compliance.
Retrieve upcoming market holidays and their corresponding open/close times. This endpoint is forward-looking only, listing future holidays that affect market hours. Use this data to plan ahead for trading activities and system operations.
Use Cases: Trading schedule adjustments, integrated holiday calendars, operational planning (e.g., system maintenance), and notifying users about upcoming market closures.
Retrieve the current trading status for various exchanges and overall financial markets. This endpoint provides real-time indicators of whether markets are open, closed, or operating in pre-market/after-hours sessions, along with timing details for the current or upcoming trading periods.
Use Cases: Real-time monitoring, algorithm scheduling, UI updates, and operational planning.
Retrieve a unified and comprehensive list of trade and quote conditions from various upstream market data providers (e.g., CTA, UTP, OPRA, FINRA). Each condition identifies special circumstances associated with market data, such as trades occurring outside regular sessions or at averaged prices, and outlines how these conditions affect metrics like high, low, open, close, and volume. By examining these mapped conditions, users can accurately interpret the context of trades and quotes, apply appropriate filtering, and ensure that aggregated data correctly reflects eligible trading activity.
Use Cases: Data interpretation, unified condition mapping, filtering and analysis, algorithmic adjustments, compliance and reporting.
GET/v3/reference/conditions
Market Hours and Timezone
Unlike traditional markets, cryptocurrency trading operates continuously, 24 hours a day, 7 days a week. This around-the-clock activity allows users to engage in trading at any time, fostering unparalleled flexibility and global participation.
All data is standardized to Coordinated Universal Time (UTC), reflecting the market’s international nature. This standardization ensures consistent integration and analysis, particularly for time-sensitive strategies spanning multiple time zones and regions.
Infrastructure and Reliability
Our infrastructure is built upon secure, high-speed connections to leading cryptocurrency exchanges worldwide. By directly accessing exchange feeds, we minimize latency and maintain data integrity, ensuring that you receive timely and accurate market information. The platform is designed for resilience and scalability, accommodating the continuous, high-volume nature of crypto trading.
We employ advanced data processing systems to manage diverse market feeds, normalizing and standardizing the information. This approach ensures that no matter which exchanges you follow, you receive consistent, reliable data essential for analytics, decision-making, and automated trading strategies.
Data Flow: From Exchanges to You
Our crypto data journey begins at numerous top-tier global exchanges. We maintain direct relationships and meet all licensing requirements, ensuring that our datasets include every trade, quote, and market event. These secure connections guarantee that data is transmitted promptly and accurately from the source to our data facility.
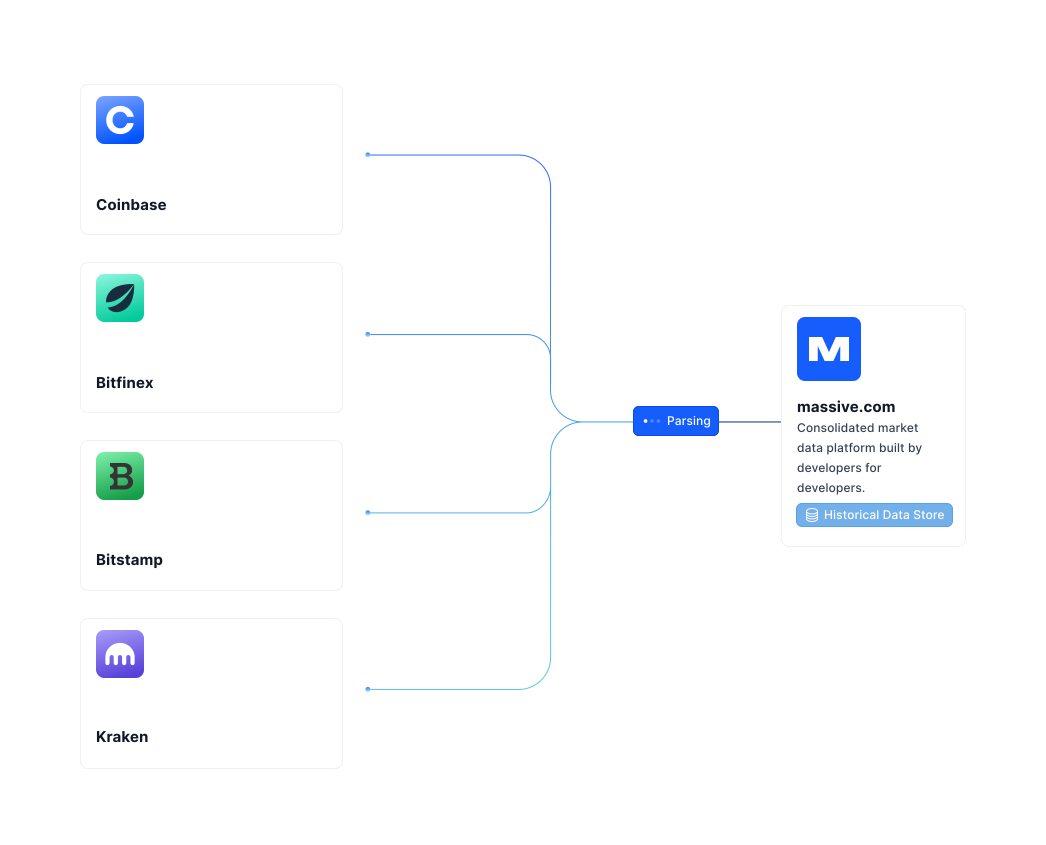
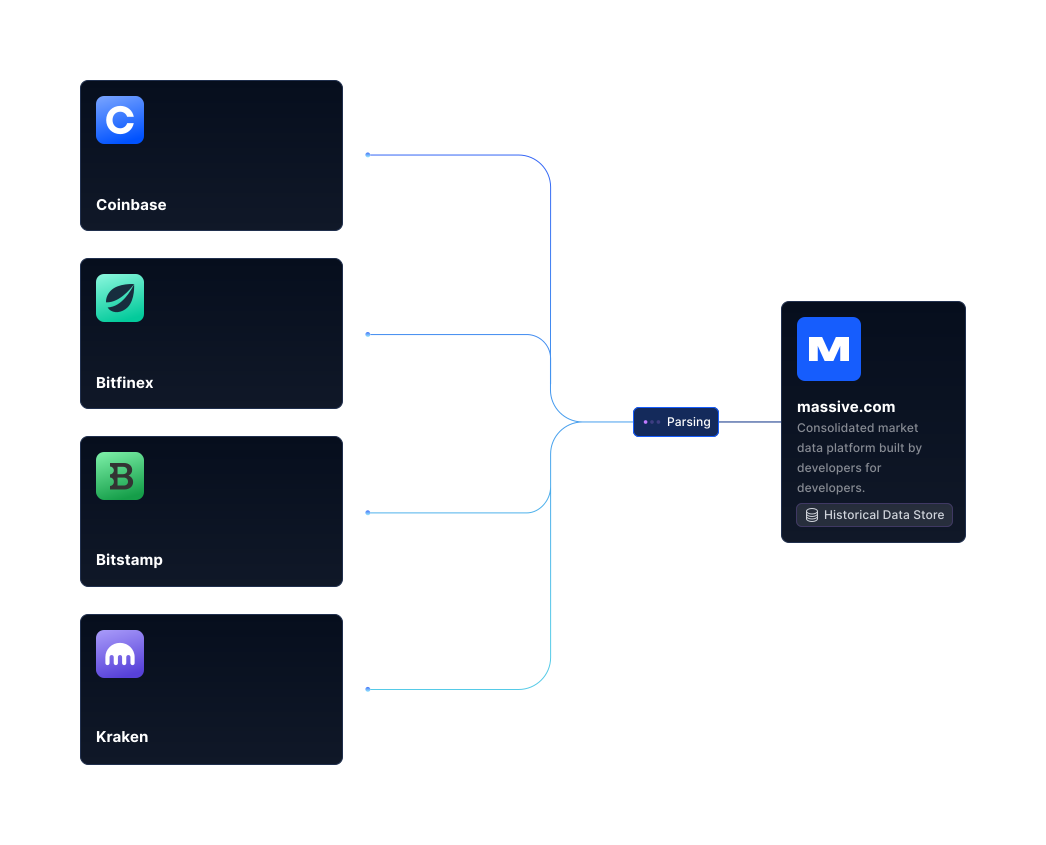
Our data is sourced directly from major exchanges including Coinbase, Bitfinex, Bitstamp, and Kraken. Binance was previously included but has not been an active source since 2021. We regularly review and update our exchange coverage to maintain transparency and data accuracy.
Data Aggregation in Cryptocurrency Markets
Cryptocurrency markets are decentralized, with assets trading on multiple, geographically dispersed exchanges. Unlike centralized equity or derivatives markets, there is no single consolidator of crypto data. To provide a holistic perspective, we aggregate data directly from each participating exchange.
Our advanced data systems unify and standardize these diverse data feeds, overcoming differences in formats and update frequencies. As a result, you gain access to a seamless and consistent data environment, supporting accurate market analysis, arbitrage opportunities, and informed trading decisions.
Next Steps
Explore our REST APIs and WebSocket streams to fully harness our extensive crypto market data. Our documentation guides you through integrating real-time and historical information into your applications, enabling tasks such as:
Monitoring real-time trades and order book updates
Accessing historical tick-level data for research
Constructing custom aggregate bars for technical analysis
Integrating data into trading algorithms, dashboards, and analytic tools
By leveraging our comprehensive crypto dataset, you can develop sophisticated trading strategies, perform market analysis, and build applications that require timely and accurate cryptocurrency market data.