
Extended Hours Are Coming to OPRA Options Data
Starting August 17, 2026, Cboe's Options Exchange is extending trading hours for select single-stock equity options with a morning GTH session (7:30–9:25 am ET) and Curb session (4:00–4:15 pm ET).

cole

Introducing
Apr 12, 2024
In this tutorial, we dive into the power of Massive.com's Flat Files for downloading and analyzing trade-level data across the entire stock market on a specific day. While the Trades API excels at fetching detailed trades for specific tickers at precise times, Flat Files streamline the process of acquiring an extensive dataset, enabling analysis that spans all trades for an entire day with just a single download. This guide aims to illustrate how Flat Files can unlock both wide-ranging market insights and the intricate details of trade-level data, providing a comprehensive toolset for deep market analysis.
Flat Files are included in all paid plans, providing immediate access to historical market data in a compressed CSV format. After signing up for an API key with a supporting stocks subscription, you have two main options for downloading data:
Each Flat File contains a day's worth of market activities, including detailed trade data, across all tickers. Here's a snippet to illustrate the file structure:
ticker,conditions,correction,exchange,id,participant_timestamp,price,sequence_number,sip_timestamp,size,tape,trf_id,trf_timestamp
A,"12,37",0,11,52983525035312,1712306654208705342,142.99,3807,1712306654208740096,5,1,0,0
A,"12,37",0,11,52983525035313,1712306654208705342,143,3808,1712306654208743168,8,1,0,0
A,12,0,11,52983525035314,1712306654429439337,143,3809,1712306654429468160,187,1,0,0
These files capture every trade for all stocks on the specified day, offering a source of truth for all market activity.
The real value in Flat Files lies in the depth of data provided for each trade across the entire market in a single file. Attributes like
In sum, the intricacies of the trade data structure provide a comprehensive view of market transactions, each attribute offering a different perspective into the world of trading. But, aggregating this data can uncover patterns such as peak trading times and preferred exchanges, enriching our understanding of market behavior.
Now that you have seen how Flat Files work, let’s dive into the actual data and explore. First, let's download an actual file and explore the data and see what we can learn. We start by downloading the trades for 2024-04-05 via the File Browser.
The
$ gunzip 2024-04-05.csv.gz
This command results in a CSV file approximately 6.2GB in size, ready for analysis. Now, let’s see the file structure using the
$ head -n 4 2024-04-05.csv
ticker,conditions,correction,exchange,id,participant_timestamp,price,sequence_number,sip_timestamp,size,tape,trf_id,trf_timestamp
A,"12,37",0,11,52983525035312,1712306654208705342,142.99,3807,1712306654208740096,5,1,0,0
A,"12,37",0,11,52983525035313,1712306654208705342,143,3808,1712306654208743168,8,1,0,0
A,12,0,11,52983525035314,1712306654429439337,143,3809,1712306654429468160,187,1,0,0
You can see here the file contains over 70 million trades.
$ wc -l 2024-04-05.csv
70,399,914 2024-04-05.csv
So, we have just over 70 million trades but how many ticker symbols are contained in this file? The following command counts the total number of unique ticker symbols in the first column of the "2024-04-05.csv" file, excluding the column header "ticker".
$ cut -d',' -f1 2024-04-05.csv | grep -v '^ticker$' | sort | uniq | wc -l
10,668
But, say for example, you wanted to see how many trades
$ grep TSLA 2024-04-05.csv | wc -l
1,549,605
We did a preliminary exploration using command-line tools to get a sense for what’s contained in this file, now let’s transition to a more detailed analysis through Python scripting. Python is amazing for data analysis and we can drill down into specific aspects of the market activity.
Here’s a Python script for analyzing the dataset, that identifies the top 10 most traded stocks and calculates their respective percentages of the total trades (code here).
TSLA: 1,549,605 trades, 2.20% of total trades
NVDA: 788,331 trades, 1.12% of total trades
SPY: 669,762 trades, 0.95% of total trades
AMD: 587,140 trades, 0.83% of total trades
MDIA: 561,698 trades, 0.80% of total trades
AAPL: 540,870 trades, 0.77% of total trades
SOXL: 533,511 trades, 0.76% of total trades
QQQ: 508,822 trades, 0.72% of total trades
CADL: 466,604 trades, 0.66% of total trades
AMZN: 465,526 trades, 0.66% of total trades
You can see here
What about if you wanted to look at the distribution of trades across different exchanges? Well, let’s use a similar python script (code here).
Exchange 4: 25,570,324 trades, 36.32% of total trades
Exchange 12: 15,147,689 trades, 21.52% of total trades
Exchange 11: 6,877,306 trades, 9.77% of total trades
Exchange 19: 5,098,852 trades, 7.24% of total trades
Exchange 10: 4,006,611 trades, 5.69% of total trades
Exchange 8: 3,686,168 trades, 5.24% of total trades
Exchange 15: 2,446,340 trades, 3.47% of total trades
Exchange 21: 2,173,744 trades, 3.09% of total trades
Exchange 7: 1,509,083 trades, 2.14% of total trades
Exchange 20: 1,296,811 trades, 1.84% of total trades
Exchange 18: 674,553 trades, 0.96% of total trades
Exchange 13: 527,767 trades, 0.75% of total trades
Exchange 2: 417,295 trades, 0.59% of total trades
Exchange 3: 393,919 trades, 0.56% of total trades
Exchange 17: 230,210 trades, 0.33% of total trades
Exchange 1: 183,010 trades, 0.26% of total trades
Exchange 9: 159,020 trades, 0.23% of total trades
Exchange 14: 1,211 trades, 0.00% of total trades
This illustrates the market's backend infrastructure, with exchanges
The stock market's trading day is divided into three key phases: pre-market, regular market, and after-hours trading, each with distinct characteristics and volumes. Notably, within the regular market the initial 15 minutes after the market opens and the final 15 minutes before it closes are often the busiest times, reflecting heightened trading activity as traders react to overnight news or prepare for the next day.
To visualize these dynamics, we can use a Python script to create a histogram aggregating trades into 30-minute intervals (code here), providing a clear view of when trading activity concentrates during the day. This analysis aims to highlight the distribution of trading volume across the day, from pre-market to after-hours.
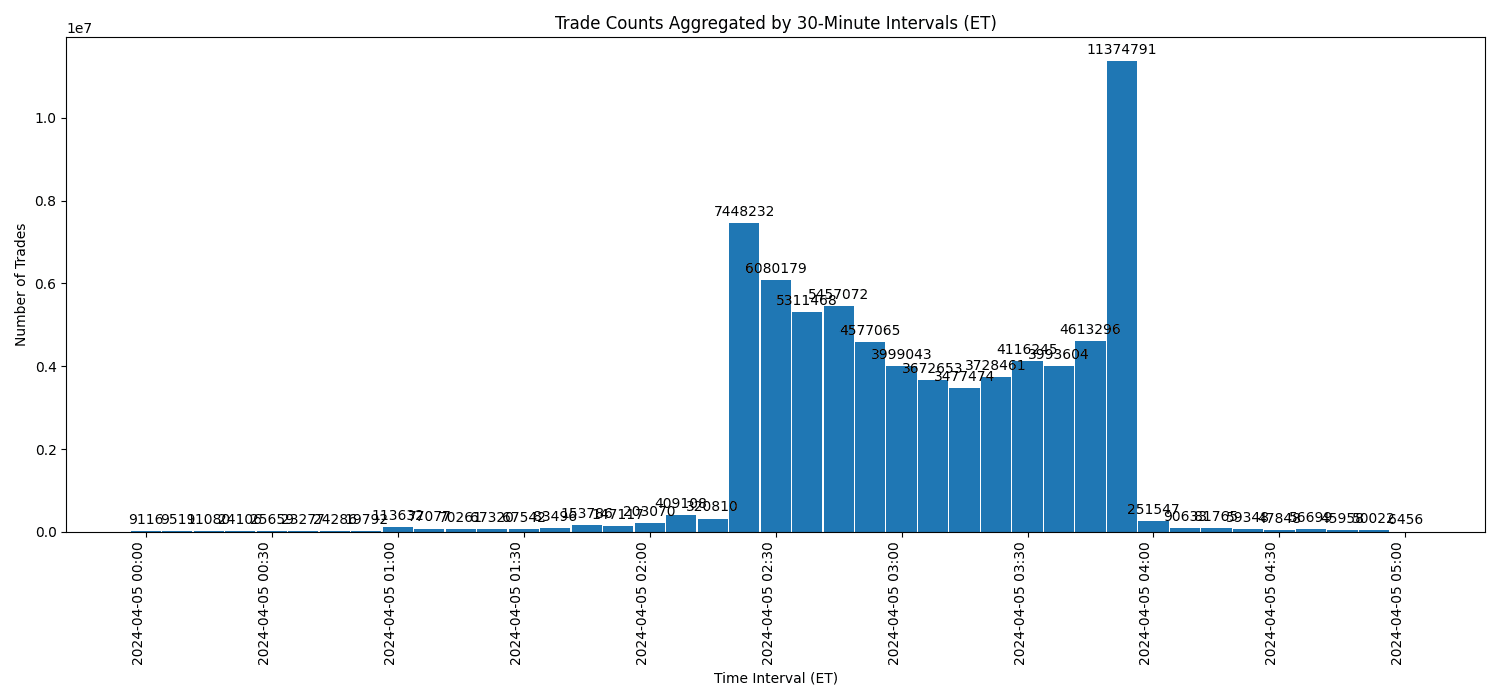
The resulting histogram vividly illustrates the intensity of trading activity throughout the day. Peaks during the opening and closing periods of the regular trading session underscore the critical windows of heightened market activity, aligning with our expectations of busy periods. Meanwhile, the visualization also brings into focus the relative calm of mid-day trading and the contrasting volumes seen during pre-market and after-hours sessions.
For many, the term 'stock market' conjures up images of a singular, unified marketplace where shares are traded en masse. In reality, the stock market is not just one entity; it's a decentralized system composed of multiple exchanges. When an order to buy or sell a stock is placed, it can be routed to any one of these exchanges, depending on various factors such as the time of day, type of trade, available prices, commissions, and specific routing preferences of brokers. This distribution across exchanges ensures that traders and investors have access to the best possible prices and provides a competitive landscape that encourages fair and efficient trading.
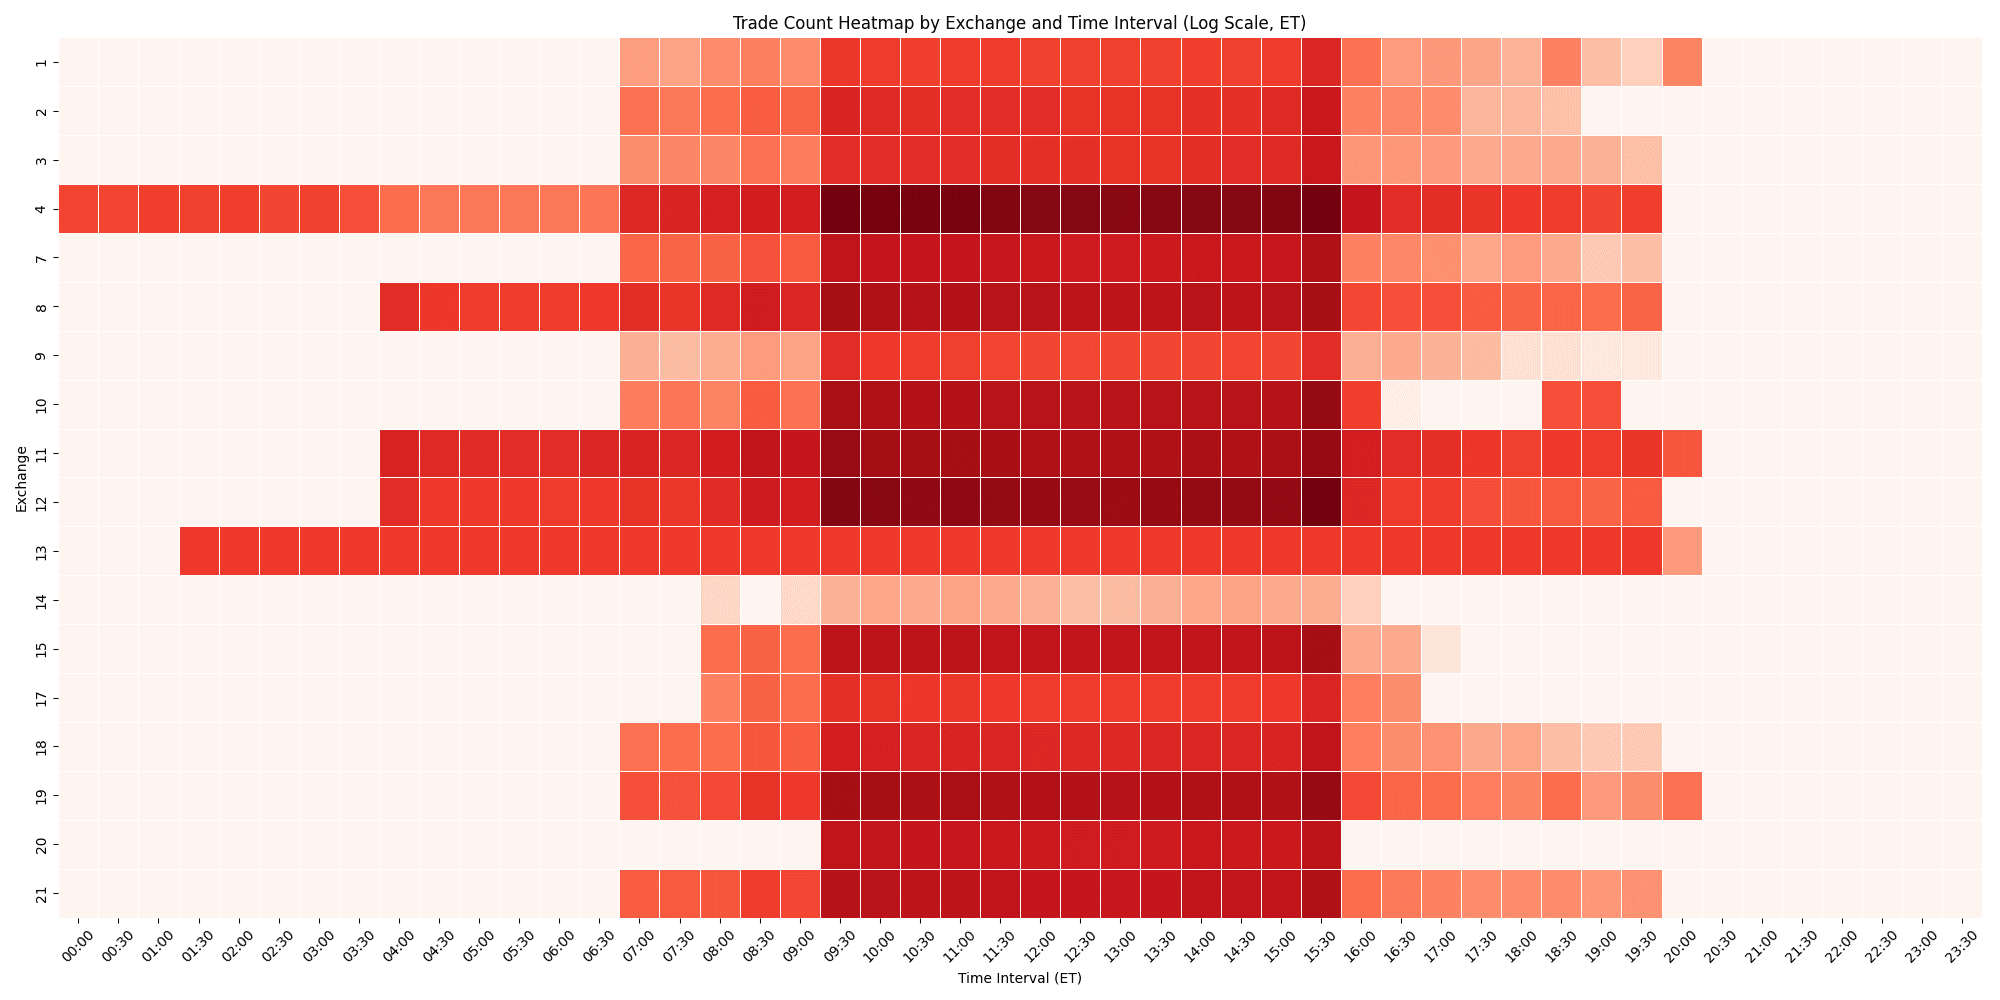
We can use a Python script that aggregates trades by exchange into 30-minute chunks, setting the stage for a visual analysis. This approach will highlight trade flows, including opening hours and peak activity times, across the exchanges (code here).

The analysis reveals much more than just the volume dominance of certain exchanges; it uncovers operational patterns and hours of operation, including earlier start times indicated by significant pre-market activity on some exchanges. Moreover, the heatmap visualization brings to light the pivotal roles of Exchanges 4 and 12, which collectively process approximately 50% of all trades, highlighting their central importance in the market's framework. These insights, from trading intensity to the strategic timing of operations across various exchanges, provide a clearer understanding of the intricate market dynamics, underlining the significance of these exchanges in facilitating a substantial portion of the day's trading activity.
Flat Files are a powerful tool for comprehensive market analysis, offering a seamless transition from broad market insights to detailed trade-level details without many API calls. This tutorial hopefully highlighted their utility in revealing trading patterns, from identifying peak activity times to analyzing trade volume distribution across exchanges, particularly the significant role of Exchanges 4 and 12.
Beyond simplifying workflows, Flat Files enable a depth of market analysis that is essential for informed decision-making. They allow developers and traders to closely inspect the market's mechanics, leading to optimized trading strategies and a deeper understanding of market behavior. In essence, Flat Files unlock the potential to discover the market's vastness through its intricate details, providing a foundation for data-driven insights that drive strategic decisions.
Happy exploring!

Justin
editor
See what's happening at Massive
Starting August 17, 2026, Cboe's Options Exchange is extending trading hours for select single-stock equity options with a morning GTH session (7:30–9:25 am ET) and Curb session (4:00–4:15 pm ET).
cole

A SEC 8-K API that labels what actually happened. Query filings by event type (CEO departures, cybersecurity incidents, M&A), with source-cited tags.

rian

In this post, we'll walk through how Earnings Watcher built its analytics layer on Massive's options chains and snapshots, why Fair Market Value anchors its scanner, and how the same API pattern extended from options into post-earnings drift analysis on the underlying equity.

alexnovotny