Insider Holdings and Insider Activity Expand Massive's SEC Filings Data
Nov 13, 2026
Massive's SEC filings data now includes Insider Holdings and Insider Activity. Insider Holdings returns each insider's role and current share count at a company. Insider Activity returns each company's daily open-market insider buying and selling, with trades made under pre-scheduled 10b5-1 plans broken out. Finding which companies insiders have been buying this month used to mean reconciling thousands of filings, and now it takes one request. Both endpoints are included in every Stocks plan and are updated daily.
What Insider Filings Are
Directors, executive officers, and anyone holding more than 10% of a company's shares must report their holdings and trades to the SEC. They file Form 3 when they become an insider, Form 4 within two business days of most trades, and Form 5 once a year for anything not yet reported. Insiders sell for many routine reasons, such as taxes or a 10b5-1 plan set up months in advance. Open-market purchases usually mean the insider thinks the stock is cheap, so buying gets the most attention, especially when several insiders at one company buy around the same time.
Massive already serves these filings one transaction at a time through the Form 3 and Form 4 endpoints. The new endpoints add a summary layer on top of them for Insider Holdings and Insider Activity.
All of these endpoints share tickers, issuer_cik, and owner_cik with each other and with our 13-F, 8-K, and 10-K data. You can go from a summary row to the underlying Form 4 transactions, or to the 8-K event that might explain them. The examples below use the Massive Python client.
Insider Holdings API
The Insider Holdings endpoint returns one row per reporting owner per company, built from all of that owner's Form 3, 4, and 5 filings. Each record includes the insider's roles (director, officer, ten_percent_owner, or other), their officer title, total shares owned split into direct and indirect holdings, ownership as a percentage of shares outstanding, and their first and most recent filing dates.
Here is how to look up NVIDIA's insiders.
Request Example
from massive import RESTClient

client = RESTClient("YOUR_API_KEY", pagination=False)

holdings = []
for h in client.list_stocks_insider_holdings(
    tickers="NVDA",
    limit=1,
):
    holdings.append(h)
print(holdings)
shares_owned_direct and shares_owned_indirect separate shares held in the insider's own name from shares held through trusts, partnerships, and family members. In the example above, 99.8% of this director's 28.8 million shares are held indirectly, and position_count shows that five separate positions were added together to reach the total.
ownership_pct expresses the stake as a percentage of shares outstanding, which lets you compare insiders at companies of very different sizes.
owner_cik is the SEC's permanent identifier for the person or entity. It does not change across companies or years, so you can use it to follow one insider across every board they sit on.
oldest_position_date is the date of the oldest position included in the total. If it is far behind last_filing_date, at least one position has not been updated recently and may be out of date.
Because the endpoint returns one row per insider, you can pull a company's full roster and rank it by stake size:
client = RESTClient("YOUR_API_KEY")
insiders = list(client.list_stocks_insider_holdings(tickers="NVDA"))
for h insorted(insiders, key=lambda h: -(h.shares_owned or0))[:5]:
print(f"{h.owner_name:<20}{', '.join(h.roles):<20}{h.shares_owned:>14,.0f}{h.ownership_pct:>8.3f}%")
HUANG JEN HSUN director, officer 871,221,2023.615%
COXE TENCH director 28,776,7490.119%
STEVENS MARK A director 27,532,8930.114%
JONES HARVEY C director 7,052,7380.029%
Teter Timothy S. officer 5,673,5580.024%
You can also query in the other direction by filtering on owner_cik, which returns every company where a given person or fund is a reporting insider.
Insider Activity API
The Insider Activity endpoint returns daily totals that have already been aggregated. Each row covers one company on one transaction date and adds up every open-market purchase and sale by all of that company's insiders. It reports counts, shares, dollar values, the number of distinct buyers and sellers, and net flow, so you do not need to parse filings or remove duplicate reports yourself.
Request Example
from massive import RESTClient

client = RESTClient("YOUR_API_KEY", pagination=False)

activity = []
for a in client.list_stocks_insider_activity(
    tickers="NVDA",
    transaction_date="2026-09-17",
):
    activity.append(a)
print(activity)
These are the fields that matter most for analysis:
net_shares and net_value are purchases minus sales, in shares and in dollars. A positive value means insiders were net buyers that day.
purchaser_count and seller_count count distinct insiders on each side, which lets you tell a single executive's trade apart from several insiders acting together.
planned_sale_value and planned_purchase_value show how much of the day's trading ran under a Rule 10b5-1 plan. Those trades were scheduled in advance, so they say much less about an insider's current view than discretionary trades do. In the example above, the entire $7.6 million sale was planned. The next day's NVIDIA row shows a single seller with $300 million in sales and a planned_sale_value of zero, which is the kind of difference that is easy to spot here and slow to find in raw filings. The plan checkbox was added to Form 4 in 2023, so these fields are zero for older filings.
last_filing_date is the date the trades became public. Insiders usually file within two business days of trading, so a backtest should key on this field rather than transaction_date to avoid look-ahead bias.
You can request a time window with the transaction_date.gte and transaction_date.lte filters, which are transaction_date_gte and transaction_date_lte in Python. If you leave out tickers, the endpoint returns activity for every company.
Demo: Screening the Market for Insider Buying
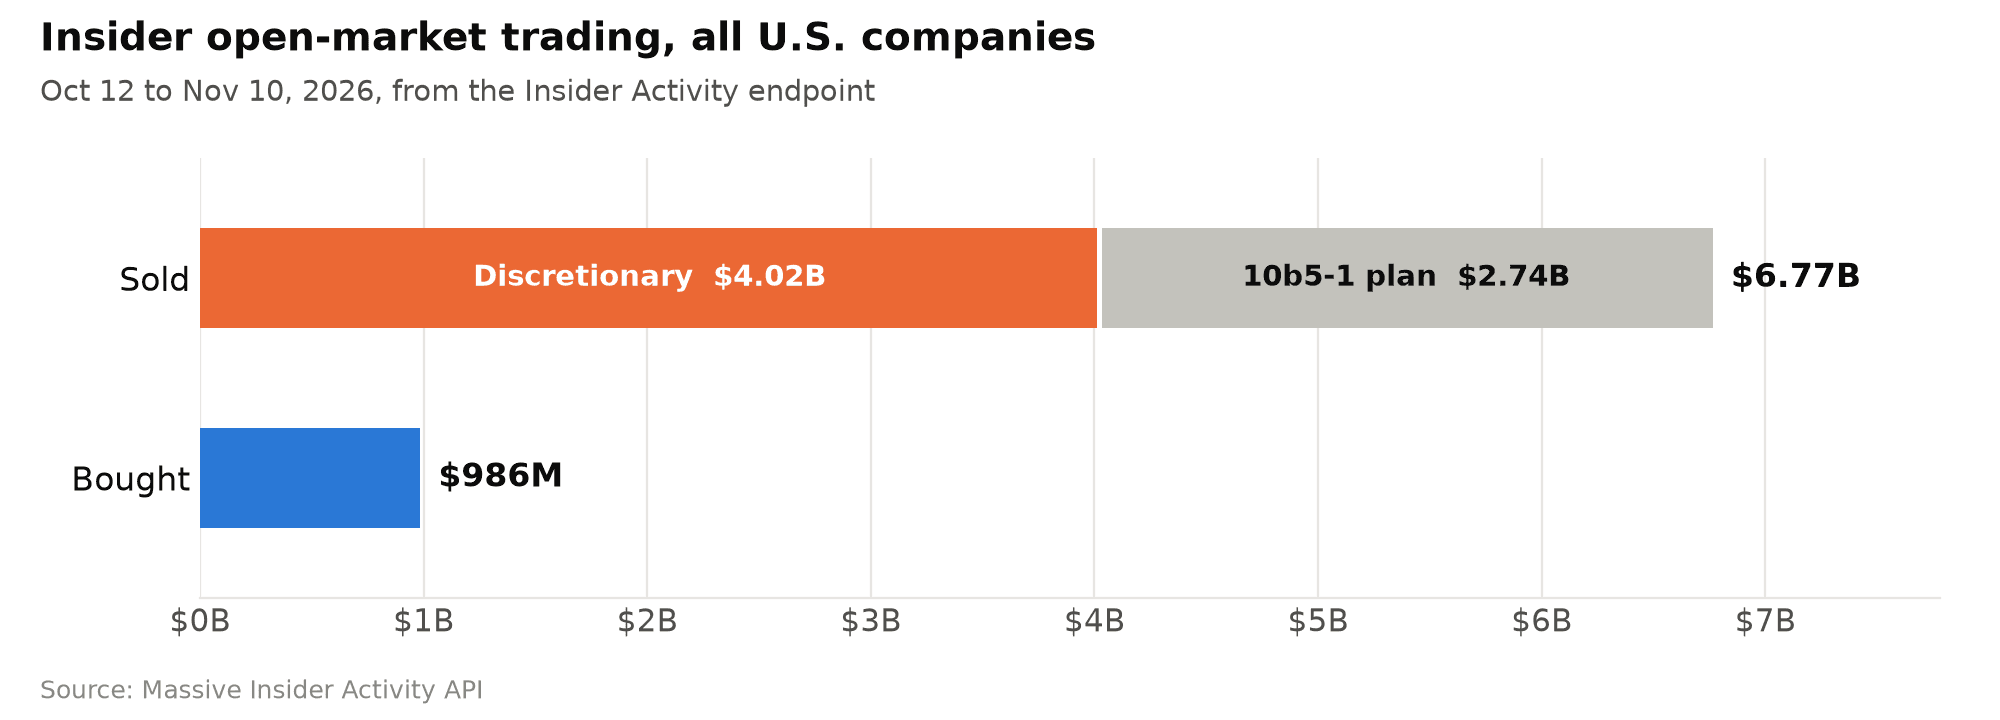
The two endpoints work well together, and a market-wide insider buying screen is a good example. For the 30 days from October 12 to November 10, 2026, the Activity endpoint returned 2,790 rows covering 1,166 companies in a single paginated request that took less than a second. Over that period insiders sold $6.77 billion of stock and bought $986 million. About $2.74 billion of the selling, or 41%, ran under 10b5-1 plans. Only 317 companies had any open-market insider buying, while 922 had selling, which is why net buying is the more useful thing to look for.
The first step is to pull every row in the window and combine the daily rows into one line per company:
from collections import defaultdict
from massive import RESTClient
client = RESTClient("YOUR_API_KEY") # pagination on: iterates every page# 1. Pull every company-day of insider activity over 30 daysrows = client.list_stocks_insider_activity(
transaction_date_gte="2026-10-12",
transaction_date_lte="2026-11-10",
limit=10000,
)
# 2. Roll the daily rows up to one line per companyscreen = defaultdict(lambda: {"name": "", "bought": 0.0, "sold": 0.0, "buy_days": 0})
for r in rows:
s = screen[r.tickers[0] if r.tickers else r.issuer_cik]
s["name"] = r.issuer_name
s["bought"] += r.purchase_value
s["sold"] += r.sale_value
s["buy_days"] += 1if r.purchase_count else0# 3. Rank by net open-market buyingtop = sorted(screen.items(), key=lambda kv: kv[1]["sold"] - kv[1]["bought"])[:10]
print(f"{'Ticker':<7}{'Company':<32}{'Net Buying':>14}{'Buy Days':>10}")
for ticker, s in top:
net = s["bought"] - s["sold"]
print(f"{ticker:<7}{s['name'][:30]:<32}{net:>14,.0f}{s['buy_days']:>10}")
Ticker Company Net Buying Buy Days
CRBD Corebridge Financial, Inc. 59,789,50617BBTX Bambusa Therapeutics, Inc. 58,639,9572MGM MGM Resorts International 51,740,8272ASPE Aspen Neuroscience, Inc. 49,999,9951ROL ROLLINS INC 49,956,6651PAM Pampa Energy Inc. 40,061,5906LRN Stride, Inc. 39,585,2457MDGL MADRIGAL PHARMACEUTICALS, INC. 34,592,2322COUR Coursera, Inc. 31,413,8493MSM MSC INDUSTRIAL DIRECT CO INC 29,034,2991
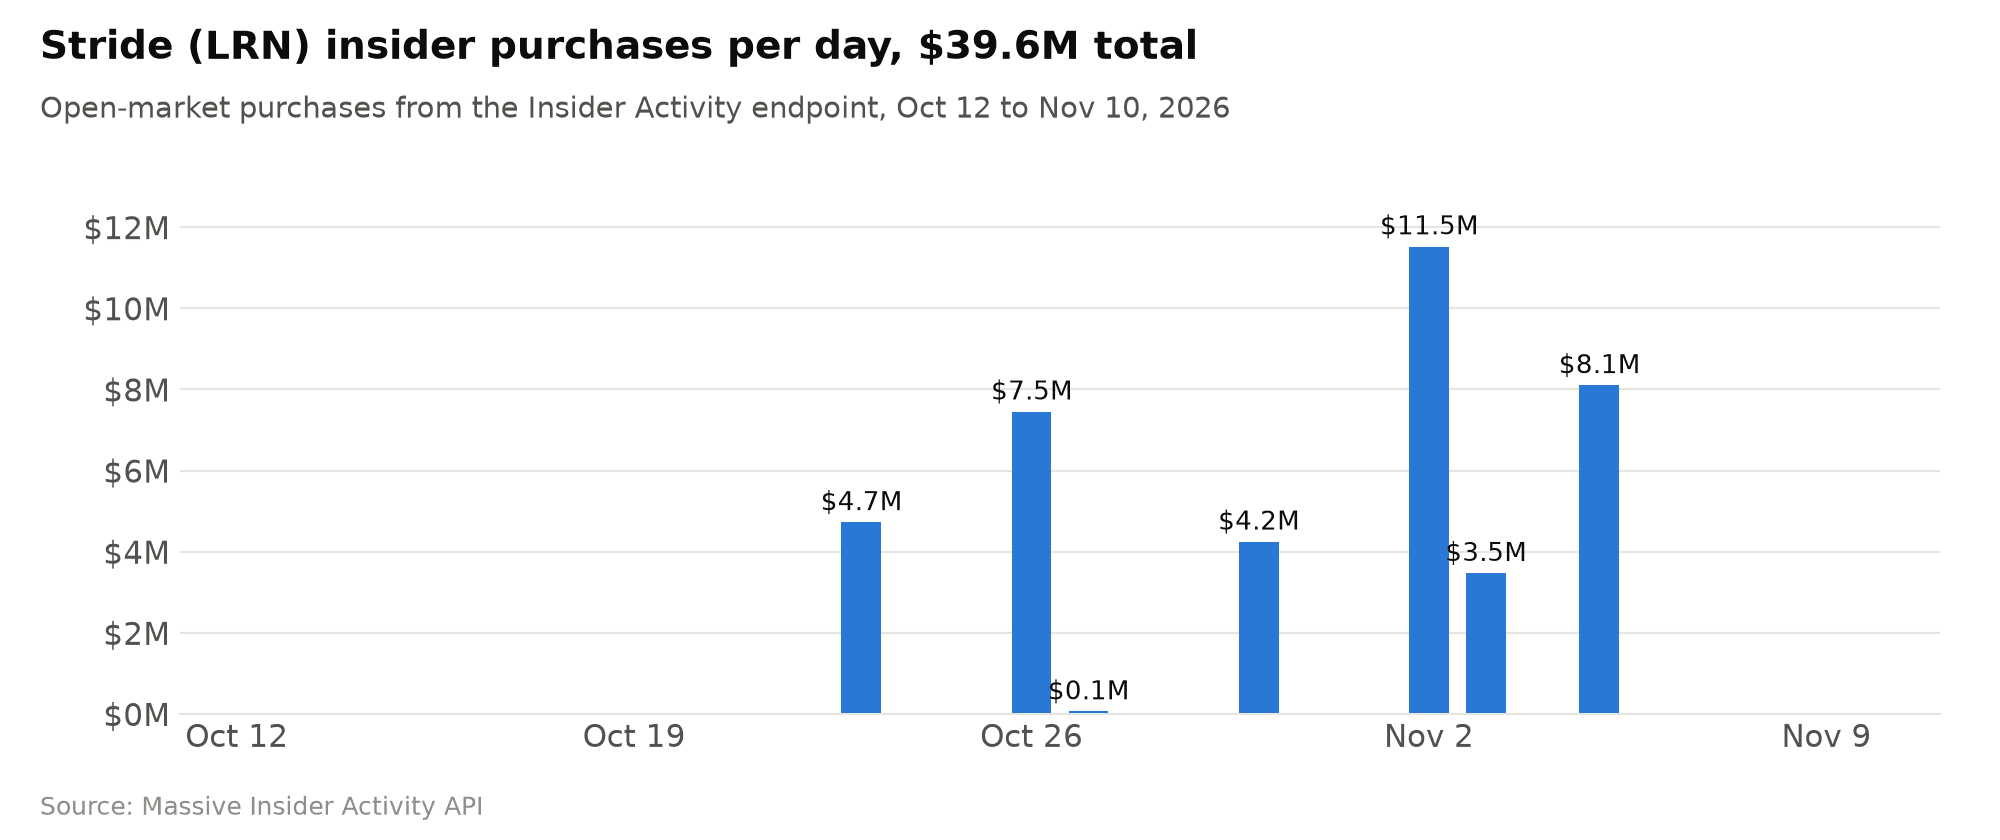
Some of these companies had one large block purchase on a single day, while others had steady buying over several weeks. Stride (LRN) stands out, with about $39.6 million of net buying spread across seven trading days and no insider selling.
To see who was buying, pass the ticker to the Holdings endpoint and filter to insiders who filed during the same window:
for h in client.list_stocks_insider_holdings(
tickers="LRN",
last_filing_date_gte="2026-10-12",
):
print(f"{h.owner_name:<28}{', '.join(h.roles):<12}"f"{h.shares_owned:>12,.0f}{h.ownership_pct:>8.2f}% {h.last_filing_date}")
Shepherd Brian A. director 23,5360.06% 2026-11-10Haggart Dylan G. director 2,236,0335.32% 2026-11-09Fivespan Partners GP, LLC other 2,236,0335.32% 2026-11-09Fivespan Partners, LP other 2,236,0335.32% 2026-11-09
One board member and his affiliated investment firm have built a 5.3% stake, and a second director has also been active. The director and the two fund entities file jointly, so the same 2.24 million shares appear on all three of those rows and should not be added together.
To see the individual trades, pass the owner_cik from the Holdings response to the existing Form 4 endpoint. Filtering on transaction_code="P" limits the results to open-market purchases:
for f in client.list_stocks_filings_form_4(
tickers="LRN",
owner_cik="0001567675", # Brian A. Shepherd, from the Holdings response transaction_code="P", # open-market purchases only filing_date_gte="2026-10-12",
):
print(f"{f.transaction_date}{f.transaction_shares:>8,.0f} sh @ ${f.transaction_price_per_share:,.2f}"f" = ${f.transaction_value:>12,.0f} 10b5-1: {f.aff_10b5_one}")
2026-11-024,880 sh @ $76.90 = $ 375,27210b5-1: False
2026-11-035,000 sh @ $74.40 = $ 372,00010b5-1: False
2026-11-027,120 sh @ $76.54 = $ 544,96510b5-1: False
2026-11-035,000 sh @ $75.50 = $ 377,50010b5-1: False
The second director bought 22,000 shares for about $1.67 million at prices between $74 and $77 over two days, and none of it was under a 10b5-1 plan. This step also shows why the summary endpoints are useful. The first director and his two fund entities report each purchase jointly, so every one of their trades appears three times in Form 4. Insider Activity counts each trade once, which is why its $39.6 million total equals the fund's $37.9 million plus this director's $1.67 million. Three endpoints and about 40 lines of Python took us from every insider trade in the market to a company with persistent buying, the people doing the buying, and the prices they paid.
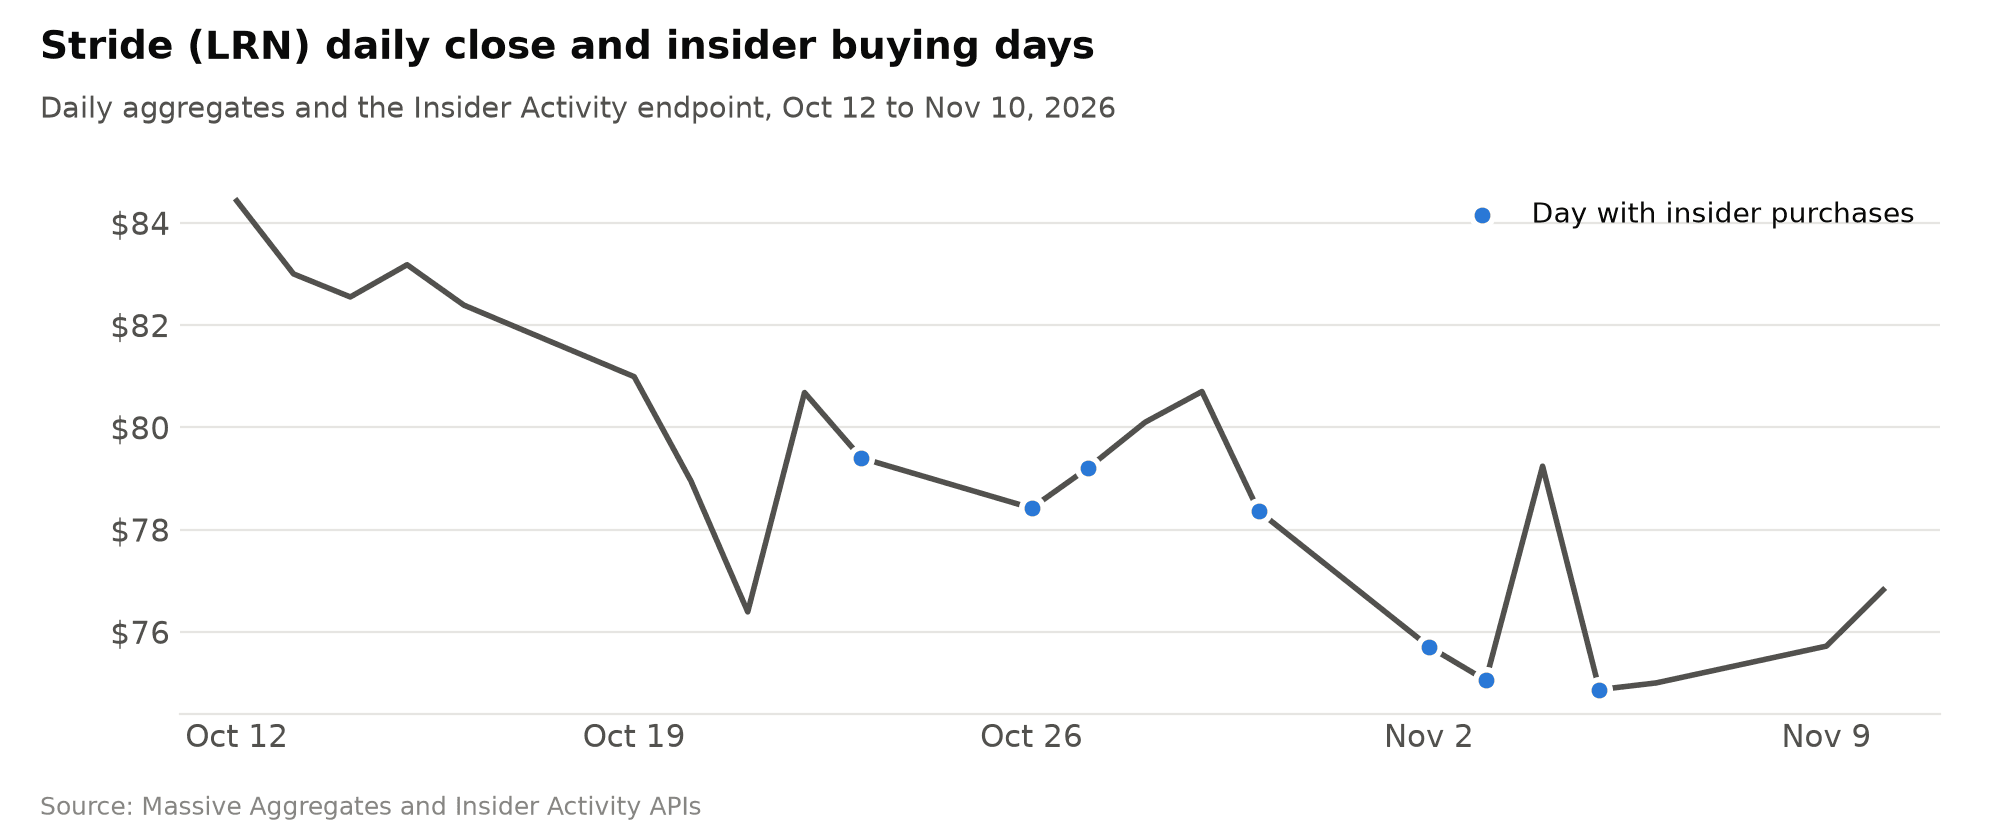
Adding Massive's daily aggregates puts the buying in context. The purchases started after the stock fell from about $84 and continued as it drifted toward $75.
There are several natural ways to extend this screen:
You can exclude 10b5-1 trades and require a purchaser_count of at least two to find cluster buying.
You can join net insider flow with Massive aggregates to measure returns after insider purchases, keyed on last_filing_date.
You can use owner_cik to follow a particular investor or director across every company where they are an insider.
You can run the screen on a daily schedule and alert when a new company appears.
Next Steps
Insider Holdings and Insider Activity are available now in every Stocks plan and are updated daily. Holdings tells you who a company's insiders are and how much they own, and Activity tells you how much they bought and sold each day, with 10b5-1 trades already separated out. Both are built from SEC Forms 3, 4, and 5, both work with the Form 3, Form 4, 13-F, 8-K, and 10-K endpoints we already offer, and neither requires you to parse a filing.
If you already use Massive for prices and fundamentals, insider flow is now one more dataset you can join to them, whether you are screening for cluster buying, adding a factor to a model, or checking who has been trading a stock you hold. You can get started with the Python client and an API key from your dashboard, and our sales team at sales@massive.com can help with business plans and larger integrations.
Disclaimer
This content is for educational purposes only. It is not investment advice or a recommendation to buy or sell any security, and the companies mentioned are used only to illustrate the data.
Massive's new Insider Holdings and Insider Activity endpoints turn SEC Form 3, 4, and 5 filings into each insider's current stake and each company's daily net insider buying and selling, so you can screen every U.S. company for insider activity with a single API call.
Massive US stock data is now available to AI agents via x402. Pay per request in USDC on agent.massive.com, with no account or API key. Built with Coinbase.
Starting August 17, 2026, Cboe's Options Exchange is extending trading hours for select single-stock equity options with a morning GTH session (7:30–9:25 am ET) and Curb session (4:00–4:15 pm ET).